
A Smart Trading Blueprint playbook
The 9 Habits That Make You Disgustingly Good at Trading
Presented by Jesse Rogers, Smart Trading Blueprint
Traders who know what a setup looks like but still get pulled around by speed, emotion, boredom, and their own memory. These habits are for the person who wants a practical operating system for seeing what they do, correcting it, and making the next decision from evidence instead of feeling.
TL;DR
Your trading will not change because you promise to be more disciplined tomorrow. It changes when your process makes your decisions visible. Record yourself. Find the trapped trader. Check your state every 30 minutes. Write emotions down as they happen. Pair each trigger with a logical action. Grade every setup before entry. Grade the time between trades. Study past instances before forming an opinion. Then slice your month by setup, time, and size. These nine habits took me ten years to collect, but you can start all nine now. Forced awareness is power because what you can see, you can review, and what you can review, you can change.
Part I
The First Five Habits: See Yourself Clearly
Habit 1: Record Yourself Trading
A lot of people do not know how I originally came up on social media. I started by live trading and documenting my journey publicly around 2022. I started documenting before I had the results people would later know me for. The practice made me a better trader. The reason is simple: forced awareness is power. Turn on a screen recording before the session and speak every decision out loud. Say what the condition is, what level matters, what you need to see, where the idea is wrong, why you entered, and why you changed anything. Do not record a highlight. Record the whole session, including the quiet stretches and the ugly decisions. Then watch it end to end. What shocked me was how much my ideas could change just because volatility and price were moving in the moment. A move speeds up and suddenly a trade that was never in the plan starts to feel obvious. A candle pulls back and a valid idea starts to feel wrong. When I zoom out later, I can hear the exact moment the market's speed changed my story.
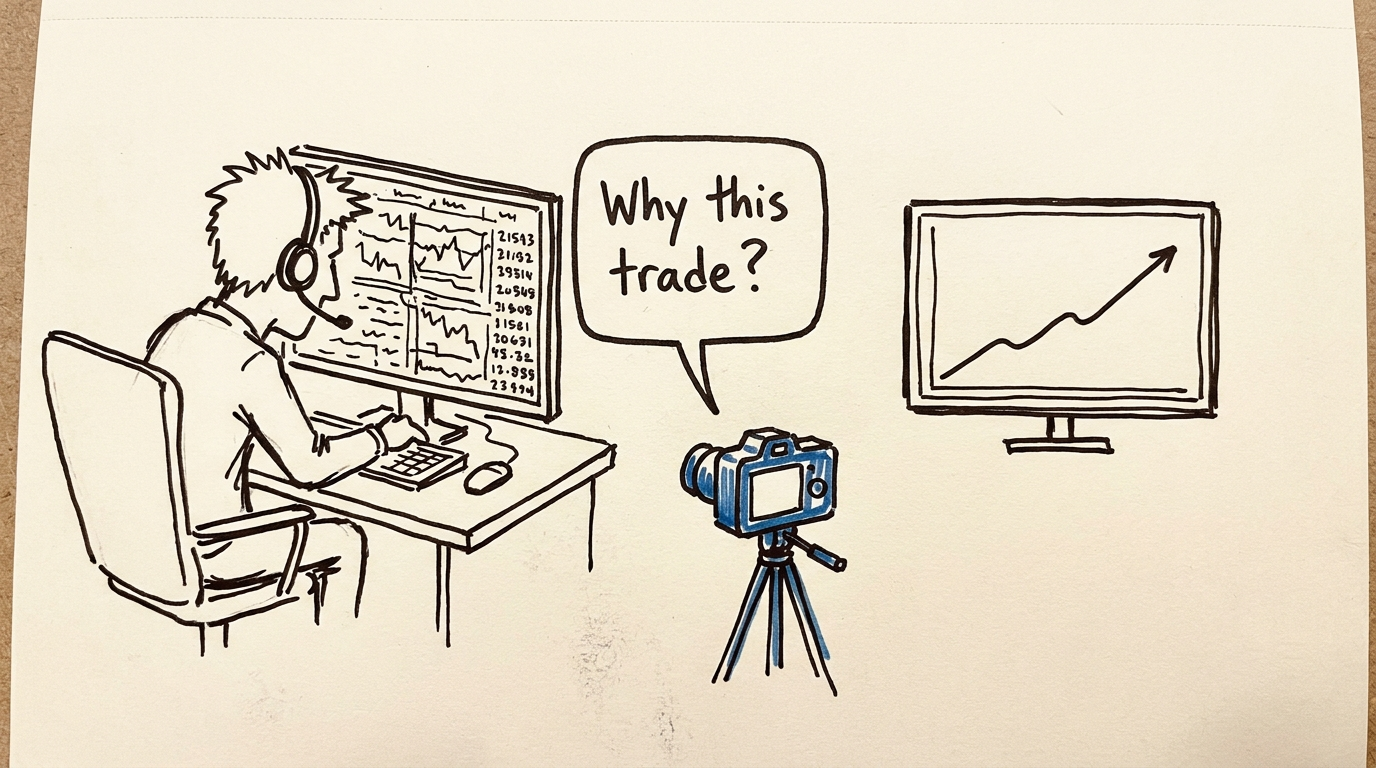
There is useful evidence behind the mechanism, as long as we do not overstate it. The act of stating and recording a choice increases self-monitoring, and the recording gives you a concrete record for structured review. Research across goal pursuit, sport, surgery, and team debriefing shows that monitoring and feedback can improve follow-through and performance. In trading, screen recording and review are established coaching practices, but controlled research has not shown that recording improves trading profits. That boundary matters. The camera is not magic. The work is the loop: state the decision, leave a record, review it against your rules, and change the next attempt. Run this habit for five sessions. After each session, write down three timestamps: the first place your idea changed, the first place your emotion changed, and the first place you broke or followed a rule under pressure. At the end of five sessions, look for the repeated moment. That is the behavior to train next. Pro tip: Review at normal speed. Fast-forwarding lets you skip the boredom and pressure that may have changed your decisions. You need to inspect those quiet stretches too.
Habit 2: Break Down One Trade by Who Was Trapped
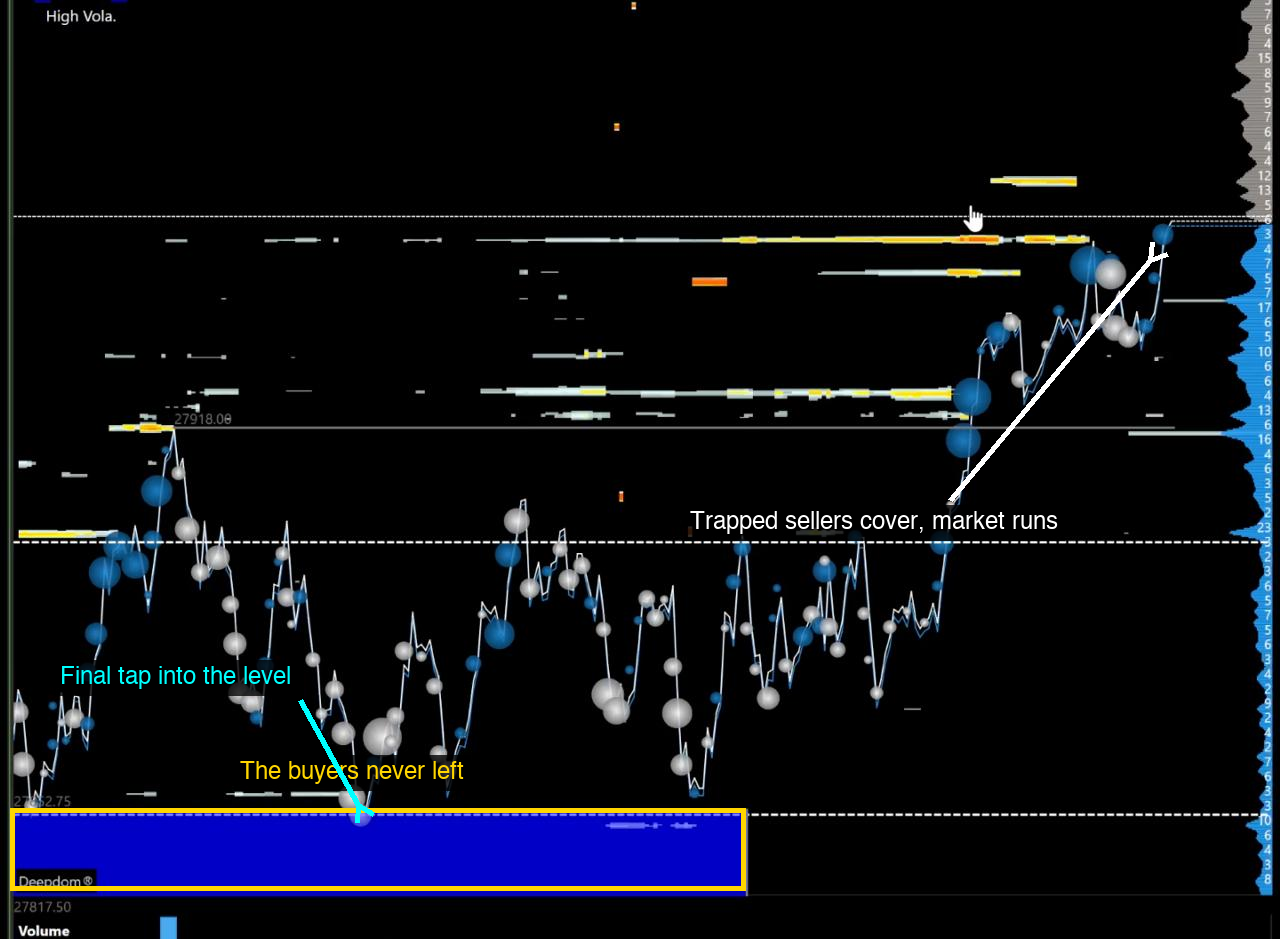
Most traders review a trade by asking whether the chart went up or down. I want you to ask a better question: who was wrong, where were they wrong, and what would they have to do next? Here is how I used that question on the trade that made $10,475 that day. You can watch me do this live here. We opened above the previous day's value area high. The value area is the price range where about 70% of the previous day's trading happened, and the value area high is its upper edge. Opening above it gave me bullish context. Price then traded back down into that upper edge, which became the level I wanted to watch. At that level I saw aggressive sellers, traders using market orders to sell immediately, push into passive buyers. Passive liquidity means limit orders already waiting in the book. Those limit buyers took the incoming sell orders without letting price keep falling. That is absorption: one side keeps hitting, but the other side absorbs the pressure and stops the move.
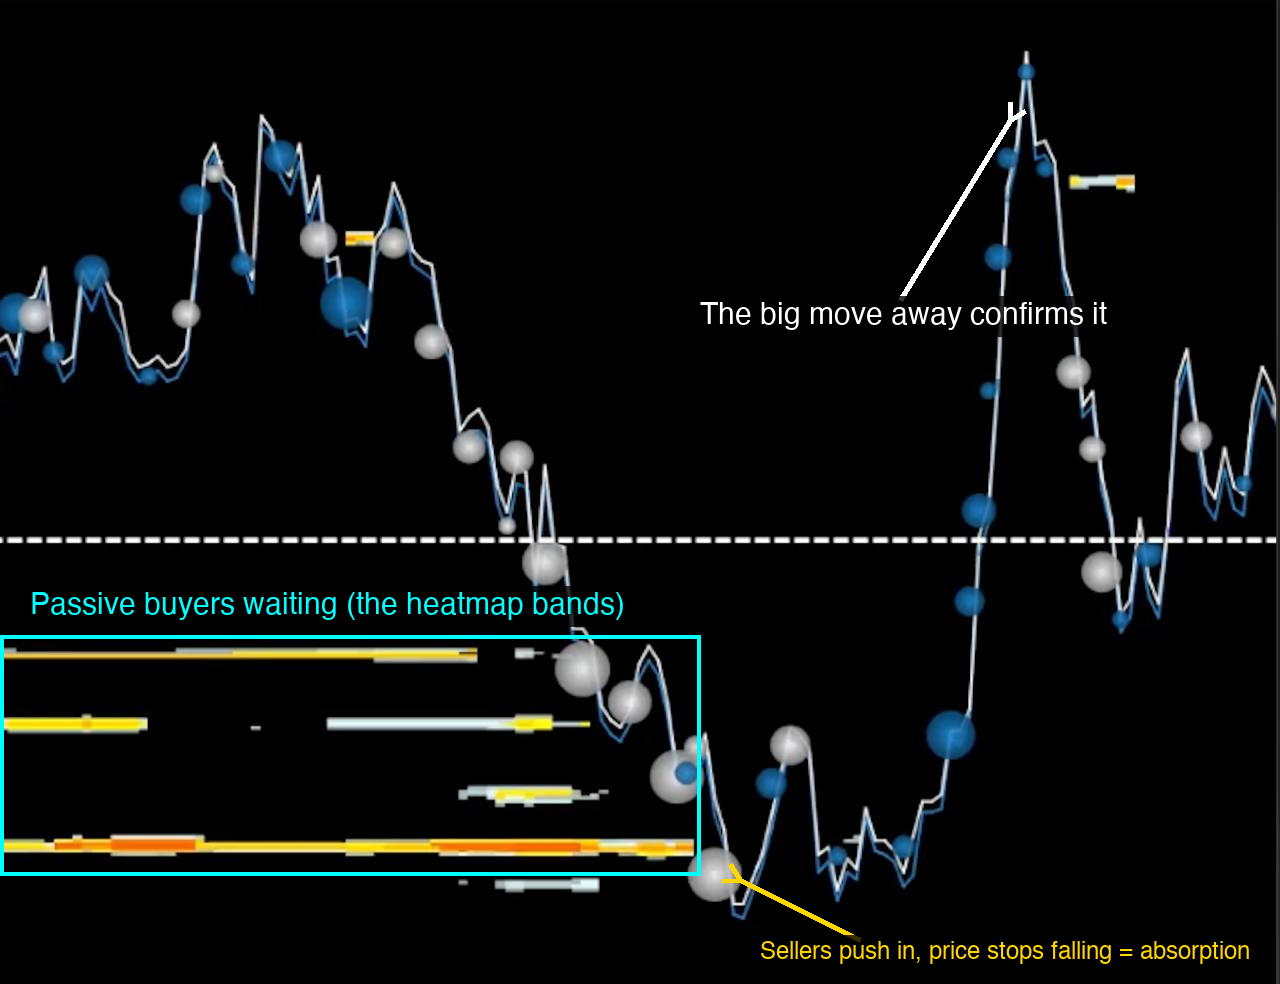
That showed me the trap. Sellers had acted aggressively at a bullish level, but they could not push through the buyers. Price popped, then came back into the area. I was fine with that retracement because the low defined whether the trap was still valid. Until we hit that low, these sellers were still trapped. The two captures below show the same trade on a wider view. The solid blue box at the bottom is Deepdom, another way to see passive buyers sitting in size at one level. Same buyers, same story, zoomed out.
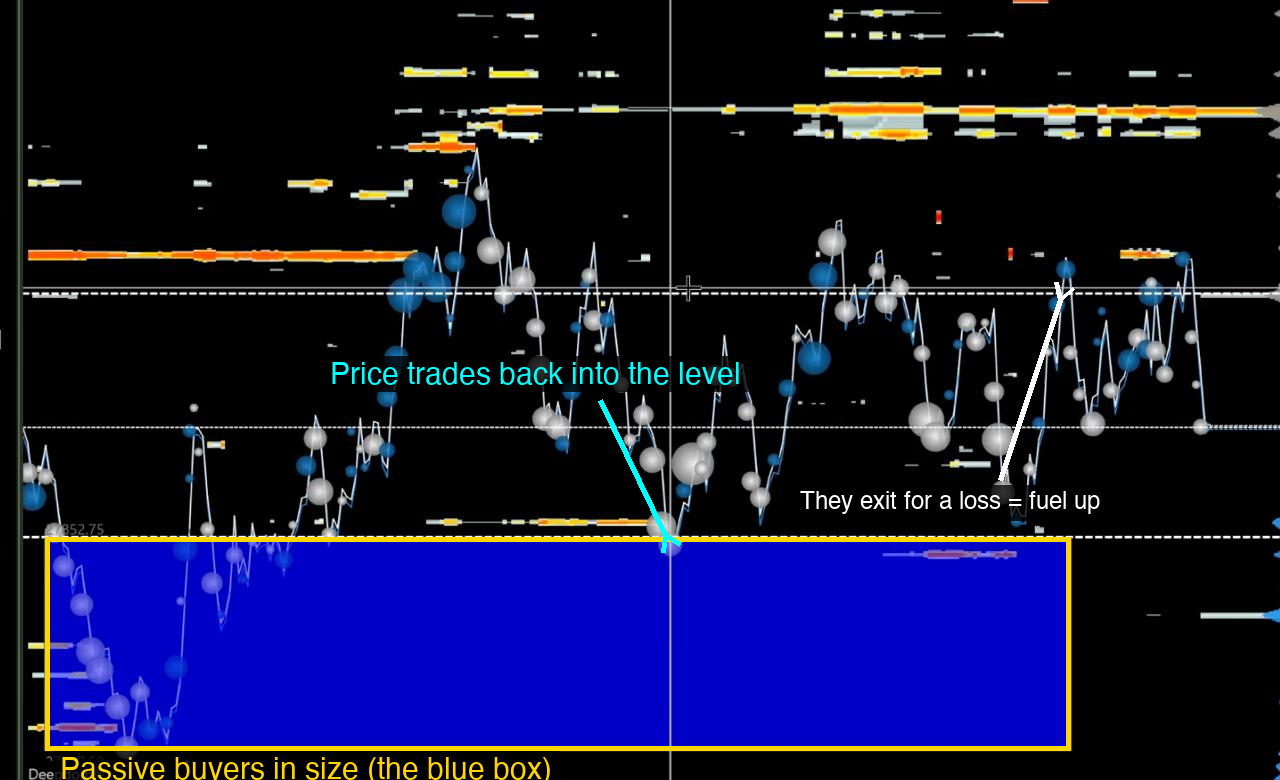
Watch what price does after the first pop. It trades back down into the level. For the trapped sellers, that move down looks like their chance to escape. It almost never gets all the way back to green for them. When the other side is in control, the market does not hand trapped traders a profitable exit. So they start exiting for a loss. And here is the part beginners miss: a seller exiting IS a buyer. Every one of those exits adds buying pressure. That wave of forced buying is a big part of what pushes the market up and away.
If you want the plain version of the worldview behind this: you are not trading candles. You are trading the decisions of the people on the other side of your trade. Every trader in a losing position has to make a decision eventually, and most of those decisions add fuel in the direction that hurts them. Once you see trades this way, the question who was trapped stops being a review exercise and becomes how you read the market live.
The next confirmation was CVD, or cumulative volume delta, the running difference between aggressive buying and aggressive selling. CVD increased as more aggressive buyers came in. We had bullish context, passive buyers absorbing sellers at the value area high, price responding upward, and CVD confirming that buyers were becoming more aggressive. From there, I managed the trade by asking the same question again and again: where is the opposition wrong now? When sellers tried to step in and price still moved higher, their failed attempt created a new place to protect. I trailed my stops every time that sellers were wrong. I did not move the stop because I was nervous or because the profit looked big. I moved it behind the latest price area that showed the opposing side had failed. Use this five-part review on one trade after every session. First, write the larger condition. Second, mark the level where buyers and sellers met. Third, name the group that became trapped. Fourth, mark the price that would free them and kill your idea. Fifth, mark each later point where that same side tried and failed again. If you cannot tell that story clearly, you do not yet have a complete trade thesis. Pro tip: Do not call somebody trapped just because price moved against them for one candle. In this trade the trap had context, a bullish open above value, a clear level, absorption by passive buyers, and then increasing CVD. The sequence created conviction.
Habit 3: Set a 30-Minute State Alarm
You check the market all day. You need to check the person making the decisions too. Before the session, set a repeating alarm for every 30 minutes. When the alarm fires, answer two questions on paper: am I calm or worked up, and am I focused or distracted? Do not wait until you feel out of control. That defeats the point. The alarm creates the pause before the damage. The worst trades often come from bad states, not bad reads, because you start reacting from one decision to the next without stepping back. If you mark worked up or distracted, leave the screen for a few minutes. Breathe slowly. Come back when you can read the plan without rushing. Then record the time and what happened before the state changed. After a week, check whether your bad states cluster after losses, after wins, or during one part of the session. The alarm is not telling you whether to buy or sell. It is telling you whether you should trust yourself to make the next decision right now.
Habit 4: Keep an Emotion Notepad
Keep one sheet of paper beside the keyboard. Every time an emotion appears, write it down while it is happening. Use plain words: anxious, angry, rushed, bored, afraid of missing out, overwhelmed. Then add the trigger in one short line. For example: "Rushed, price left my zone without me." Or: "Angry, second short stopped in ten minutes." Do not write a speech and do not argue with the feeling. Name it, name what happened, and return to the plan. On paper, the emotion loses some of its power because it stops being an invisible command and becomes a piece of data. Laboratory research shows that putting feelings into words can change the brain's response to emotional stimuli. Treat the note as data for later review, not as a guarantee that naming the feeling will immediately eliminate it. At the close, circle any emotion that appeared before a rule break, an extra trade, or a size change. After ten sessions, count the repeated emotion and trigger pairs. This notepad becomes the raw material for the next habit.
Habit 5: Pair a Logical Habit to Every Emotion
This is the emotional spine of the whole system. You can't fight emotion with emotion. You fight emotion with logic. That does not mean logic instantly shuts a feeling off. It means you stop trying to force yourself into a better emotion and move to a factual, rule-based action. Pause and reappraise what happened. Separate the observable facts from the story you are telling yourself. Then run the action you chose before the session. The goal is not to prevent emotion from ever appearing. The skill is reducing how long it governs the next decision. Emotional episodes vary, and research links rumination with longer episodes while showing that perspective shifts and acceptance can improve duration or recovery in some settings. Awareness speed is the edge. The faster I catch the state, the faster I can get back to logic. Most traders try to fix the emotion itself. They tell themselves not to be angry, not to feel fear, or not to want the trade. That is not a complete instruction. Acknowledging the state and moving to a specific factual reappraisal and a preselected action gives you something you can actually execute. This is the habit-stacking framework James Clear popularized in Atomic Habits. The underlying idea is an implementation intention: decide the response to a cue in advance. Write it as, "When this specific trigger happens, I will take this small action." The trigger becomes the alarm. The habit becomes the answer.
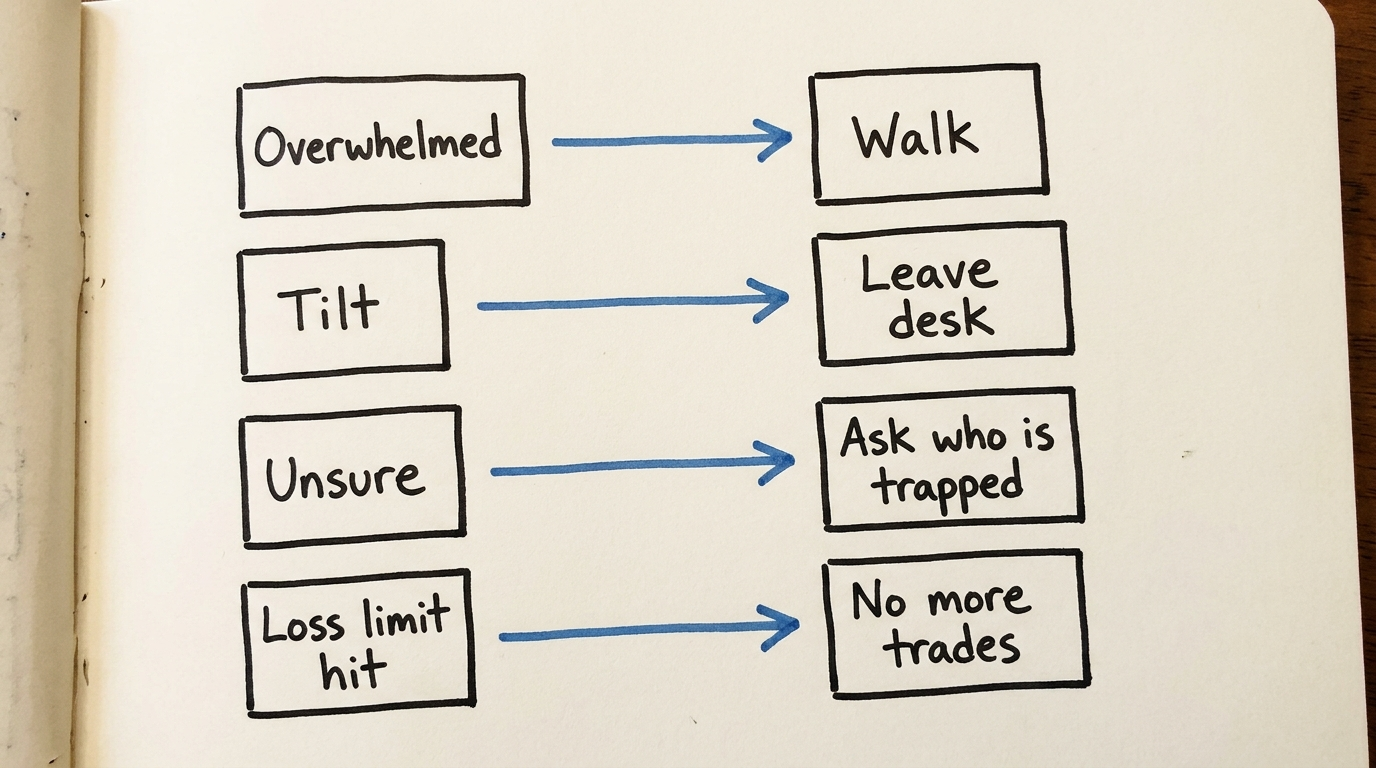
Start with these pairings: When I feel overwhelmed, I walk away from the screen. When I notice tilt, I leave the desk. When I feel unsure about a trade, I ask, "Where are people trapped, and what price proves that?" When I hit my loss limit, I take no more trades. The decision is already made. You may also need a rule for overtrading or fear of missing out. The exact trigger is personal. Do not copy my trigger and assume it is yours. Use the notepad to find what repeatedly happens before your bad decisions, then give that moment one small response. The AI move: let your broker data show you the trigger Export your trade history from your broker as a CSV. Give the file to an AI tool and ask it to look for patterns before big drawdowns, before clusters of losses, and before your trade frequency increases. A personal log can reveal candidate triggers, but a pattern does not prove the trigger caused the behavior. Look for repetition, then test the rule over the next month. I found a real pattern in my own trading: if I lose two shorts in a 10-minute period, I'm very likely to lose more money that day. I could not fix that pattern until I could see it. Once you find your version, turn it into an if-then rule. Paste this first: I attached my broker CSV. Work only from the data in this file. Find the five largest intraday drawdowns. For each one, show me what happened in the 30 minutes before the drawdown: trade direction, number of trades, time between trades, position size, and consecutive losses. Then list only the patterns that repeat in at least two drawdowns. Do not claim a pattern caused the loss. Then run this: Using the same broker CSV, find every 10-minute window where my trade frequency increased above my normal pace. Show what happened immediately before each spike, including wins, losses, direction, and size changes. Group similar sequences and tell me which sequence most often appeared before a losing day. Finally, turn the strongest repeated pattern into a rule: Take the strongest repeated warning pattern you found and write three small if-then rules I could follow during a live session. Each rule must use a trigger visible in my broker data and one action I can complete immediately, such as stop trading, leave the desk, reduce size, or review where traders are trapped. Keep the claims tied to my sample. Pro tip: Do not ask AI, "Why do I go on tilt?" That invites a story. Ask it to show the timestamped sequence that happens before the loss. You want a pattern you can inspect, not a personality diagnosis.
Part II
The Last Four Habits: Grade Everything
Habit 6: Grade Every Setup Before You Enter
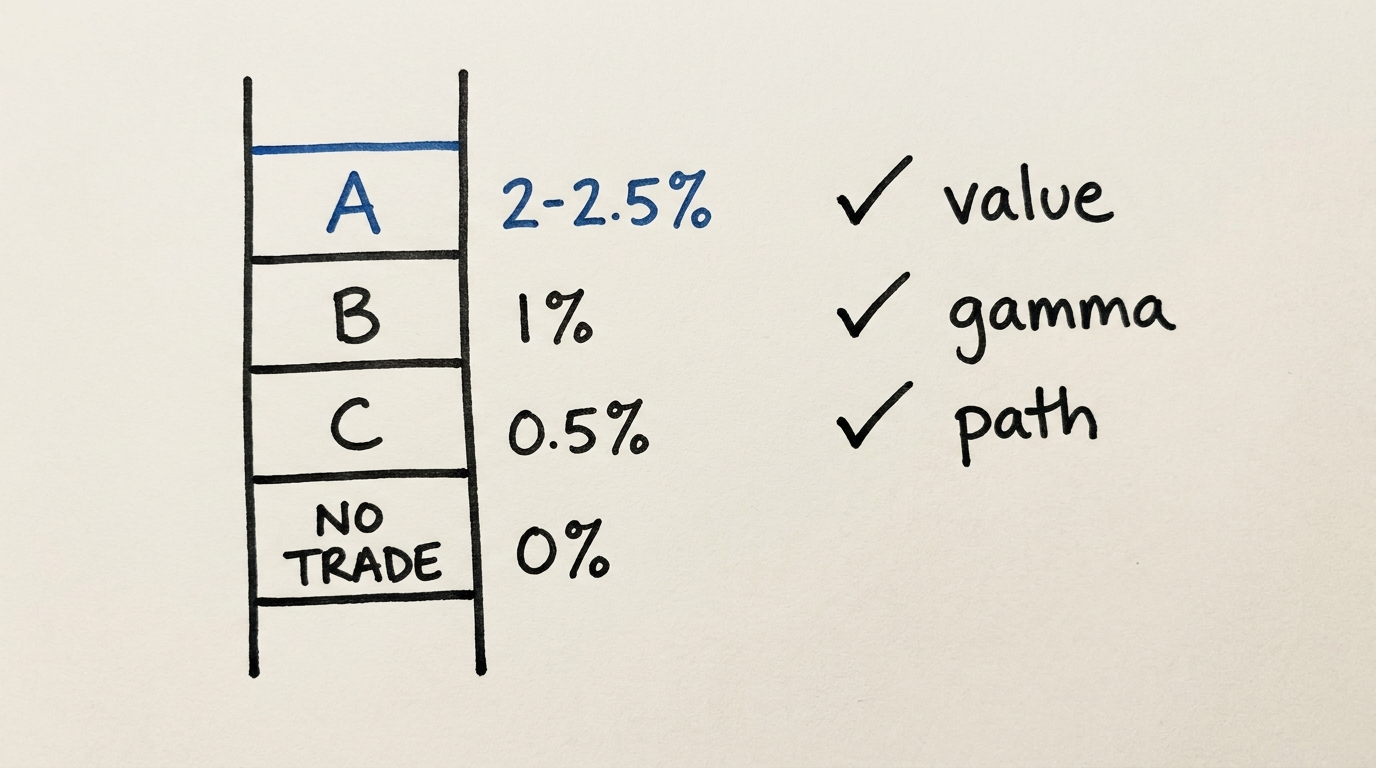
The size is the grade. Before entry, I read whether the market is set up for balance, where price rotates, or imbalance, where price expands. I grade that read through value, the gamma environment, and the path ahead. Gamma is the options positioning environment that can help moves expand when negative or pull them back toward balance when positive. When the setup and all three signals stack, an A risks 2 to 2.5%; a B with one soft factor risks 1%; the rare C with bad odds but a large possible move in low volume risks 0.5% or less; below C is no trade. Those percentages apply to your own capital. On a prop account, the A, B, C grade logic carries over exactly, but the dollar risk is anchored to the remaining drawdown buffer, the amount you can still lose before the account fails, and the buffer math works differently than a simple percent of account. My sizing SOP walks through that translation.
I wrote a full SOP on exactly how I size, [read it here]
Habit 7: Grade Your Time Between Trades
The time between trades is still part of your trading. Grade your non-trading time just like a setup. Before the session, decide what good downtime will contain. Give yourself three allowed modes: reviewing, researching, or recovering. Reviewing means updating levels or checking whether the condition changed. Researching means scanning for a new opportunity or studying a planned idea. Recovering means leaving the screen long enough to reset. Staring at candles with no purpose is not a fourth mode. At the close, grade the downtime from A to F. An A means it was structured and produced a useful review, a researched idea, or real recovery. An F means you hypnotized yourself with candles until boredom or urgency forced a trade. Track that grade beside the day's P&L for 20 sessions. The downtime grade predicts the P&L. If the bad days keep sitting beside D and F downtime, the next fix is not another entry pattern. It is a better plan for the empty minutes.
Habit 8: Study Past Instances Instead of Forming an Opinion
On a big news day, do not start with what you think the news should mean. Pull every past instance like it from the last 20 years and see what actually happened. Define the event before looking at the outcomes. "Big inflation day" is too loose. Write the exact release, surprise, or percentage move that qualifies. Gather each matching date, count the sample, and measure what happened over the next five trading days and the next 30 trading days. If the question is about a sector or asset, compare which ones did best and worst. Most samples will not hand you an obvious trade. That is useful too. When a pattern does stand out, write it as a hypothesis with the sample size, average outcome, and volatility. Only then open the chart to choose the location, invalidation, and size. Pros have samples. Everyone else has opinions. Pro tip: Do not change the event definition after seeing the result. That is how an opinion dresses itself up as research. Define first, pull the instances second, then read the result.
Habit 9: Slice Your Month Three Ways
At the end of every month, export your trades and slice the results three ways: by setup, by time of day, and by size. First, total the number of trades and P&L for each setup. Second, group the trades into 15 or 30-minute windows so you can see when you perform best and worst. Third, group them by position size so you can see whether larger trades are attached to better setups or stronger emotion. One trader found out he only blew up after losing in the first hour. He could not feel that pattern in real time. The cuts showed it to him, and the answer was not another market opinion. It was one rule: after an opening loss, take a break before the next trade. Do the same with your worst slice. Find one repeated leak, attach one behavioral rule, and run the same three cuts next month. If the numbers improve, keep the rule. If they do not, inspect the next leak. The numbers see what you cannot feel. Memory will smooth over the extra trade, the bigger size, and the bad hour. A month of timestamps will not. Pro tip: Do not review only total P&L. A green month can hide a setup that is bleeding, a time window that is dangerous, or oversized trades that got rescued by one winner.
Part III
Immediate Action Items
Immediate Action Items
Start before your next session by setting up the environment. Turn on screen recording, place one emotion sheet beside your keyboard, and schedule the repeating 30-minute alarm. At every alarm, mark calm or worked up, focused or distracted. When an emotion appears, write the emotion and trigger without trying to talk yourself out of it. Before every entry, do two things out loud. Ask who is trapped and where that group is proven wrong. Then grade the setup A, B, C, or no trade and attach the correct size before you click. During the quiet parts of the session, choose reviewing, researching, or recovering. At the close, grade that downtime. Then select one trade and break down the condition, level, trapped side, invalidation, and every later point where the opposition failed. At the end of the week, review the recordings and emotion notes for repeated triggers. Pair the strongest trigger with one logical action. If you have enough broker history, export the CSV and run the three AI prompts so you can compare what you felt with what the timestamps show. At the end of the month, slice your trades by setup, time of day, and size. Choose one leak, write one if-then rule, and test it for the next month. Then repeat the same cuts. That closes the loop: awareness, evidence, action, review. Smart Trading Blueprint provides education only. It is not financial, investment, or tax advice. Trading carries substantial risk of loss. Results vary and are not guaranteed.
Take This Further
These habits make your decisions visible. Now let an AI-powered roadmap look at your actual trading data and tell you which habit pays off first for you.
Get Your AI Roadmap