
A Smart Trading Blueprint playbook
Position Sizing Like a Professional Trader
Presented by Jesse Rogers, Smart Trading Blueprint
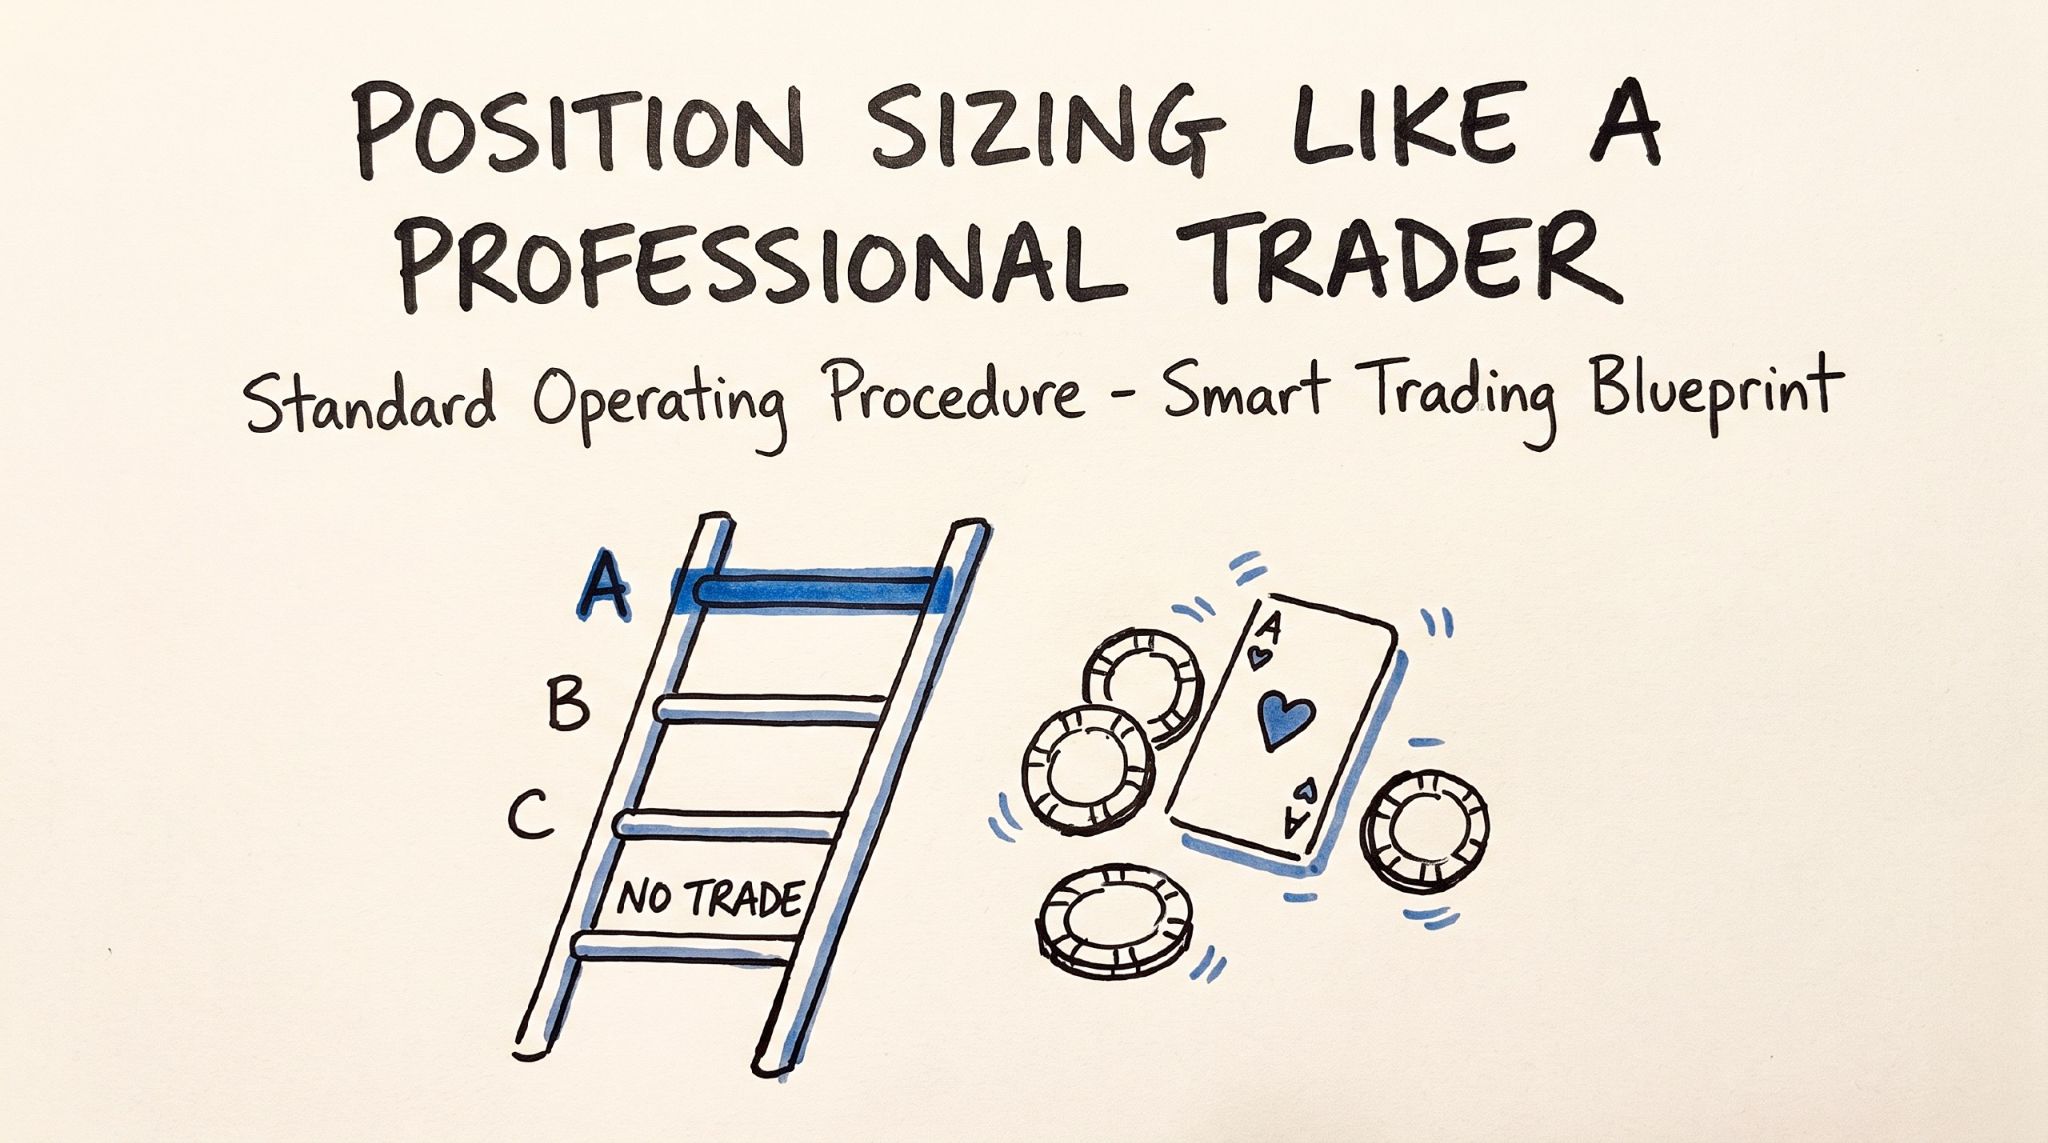
Traders who already have a working setup but still feel like they are guessing at how big to trade every single time, and who want one repeatable system that tells them exactly how much to risk on any trade, on their own account or on a prop firm challenge.
TL;DR
Most traders can map a pattern. The hard part, the part almost nobody trains, is knowing when the pattern actually has edge and sizing to it. Get that wrong and one oversized loser undoes days of good work. This SOP gives you a grading system that scores every setup A, B, or C and tells you exactly what to risk on each one, the way a blackjack card counter sizes their bet to the count. It covers your own capital and the translation to a prop firm trailing drawdown, where your real account size is the drawdown buffer, not the number on the screen. Open it, grade your next trade, size it, and stop guessing.
Part I
Why Most Traders Quietly Bleed Out
Background: Why Most Traders Quietly Bleed Out

Here is the uncomfortable truth nobody in this industry wants to say out loud.
Trading is like a casino. And we are the blackjack players.
As much as it hurts to admit this, I would rather tell you the truth than sugarcoat it like most gurus, who make it sound like we are not gamblers. At the end of the day, gambling is risking money on the outcome of a probabilistic scenario. That is what trading is.
But there is one key difference that makes trading better than the casino.
A blackjack card counter has an edge, but the casino still controls the game and the counter has to play the hand in front of him.
The trader does not.
We sit and watch multiple tables. We wait for the running count to swing in our favor. Only then do we go all in. We can get up from any table whenever we want, and we can refuse to gamble at all.
The summation of all of it is this. We get to select our odds. That is the one thing a casino will never let a card counter do, and it is the entire reason this works. We get to select our odds.
Most traders never get there. They do one of two things. They size every trade the same no matter how good or bad the setup is. Or they get reckless after a loss and size up to make it back. Both are death. The first is a slow death by a thousand cuts. The second is a fast death where you give back days of profit in one afternoon.
The skill that separates the traders who make it from the ones who blow up is not picking direction. Mapping the pattern is easy. Anyone can draw a line. What is hard is knowing when the pattern actually has an edge, and then having the discipline to size to that edge. That is what this SOP teaches.
Part II
Why It Works: Balance, Imbalance, and the Running Count
Why It Works: Balance, Imbalance, and the Running Count
Get the model first. Once you have it you can adapt to any market, any day, any account. Every trade comes down to two questions:
Are we expecting balance or imbalance? Are we trading with the direction we expect, or against it?
That is the whole engine. The grade of your setup is just how many things line up in your favor when you answer those two questions. The size is the grade. Balance vs imbalance
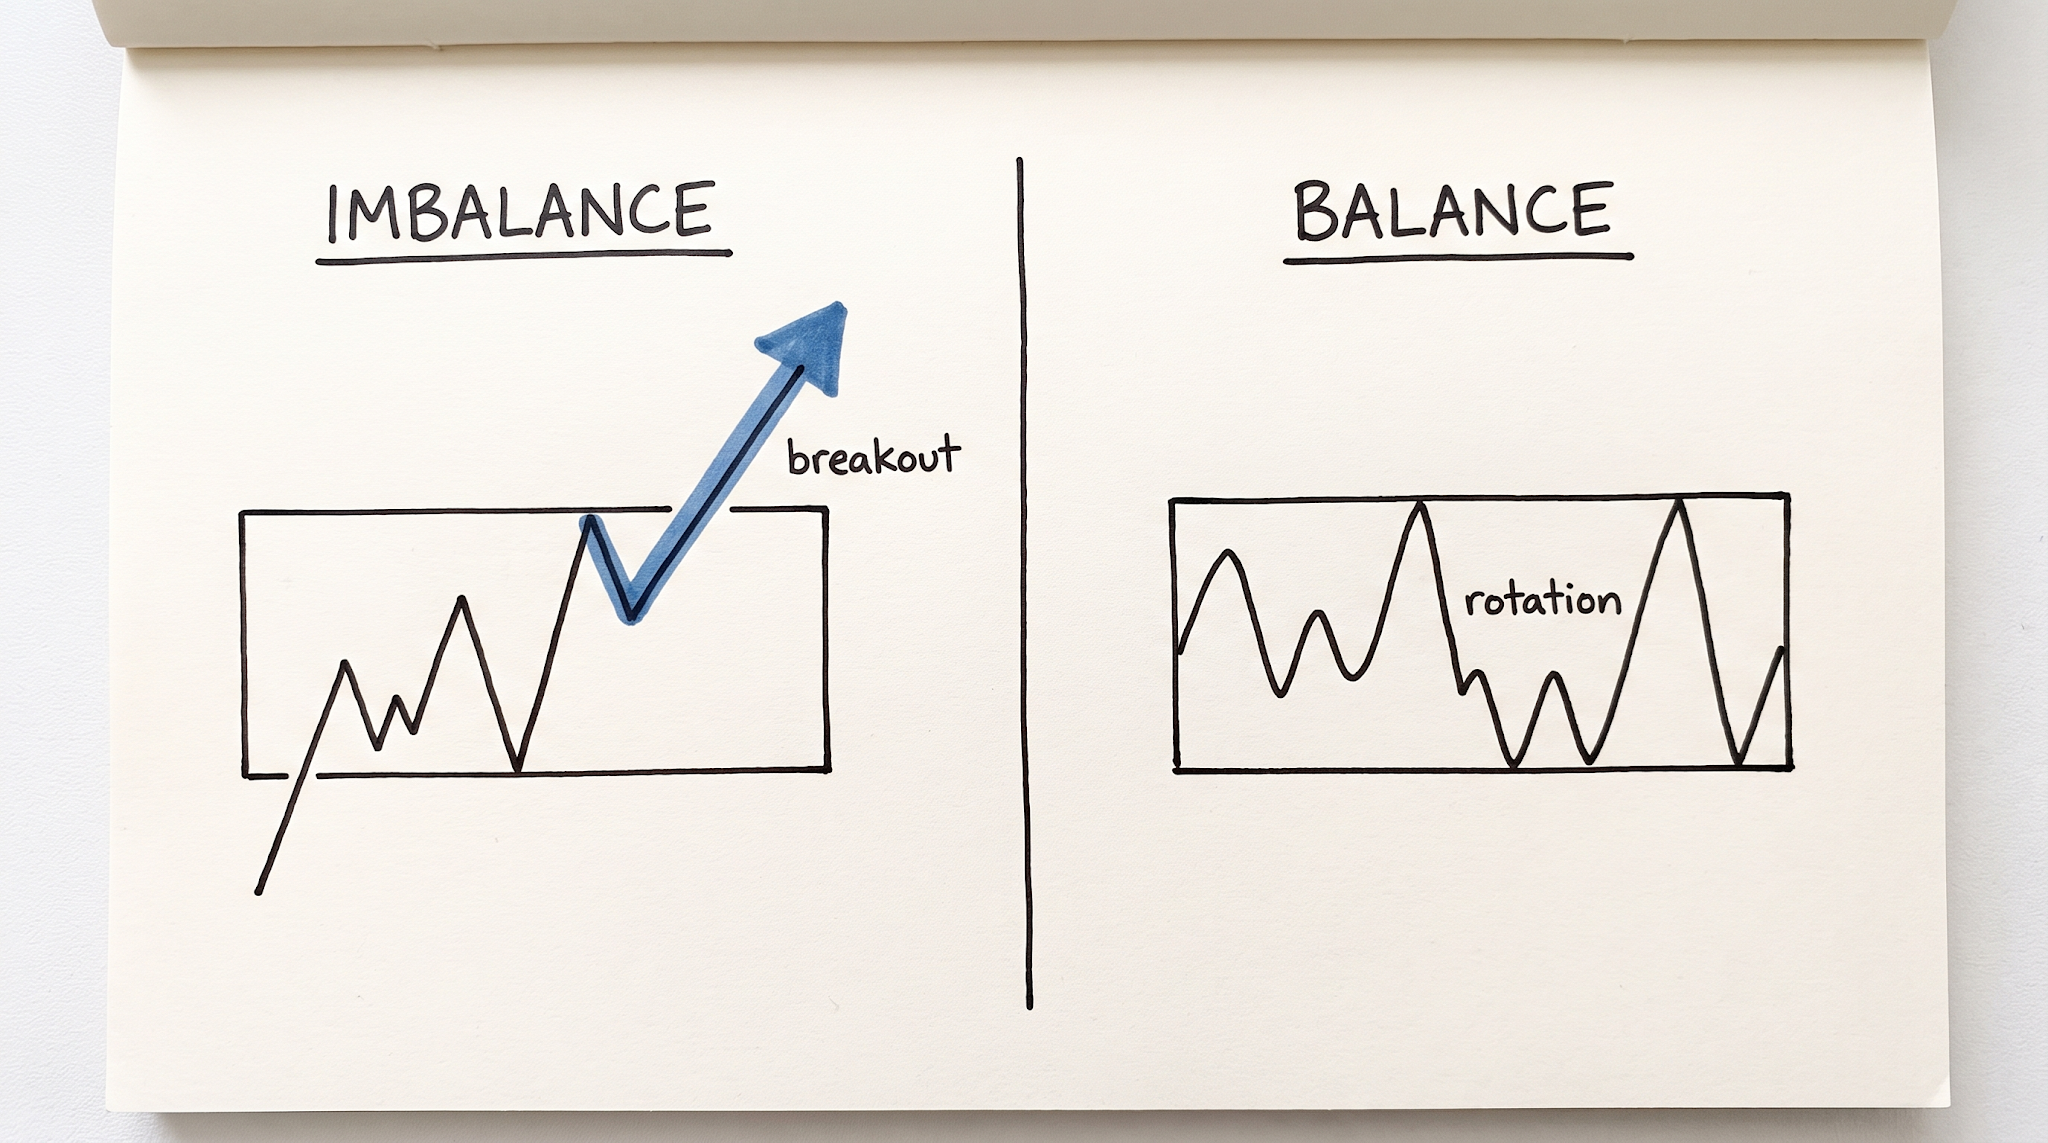
The market is either set up to expand (trend, run, break out) or to contract (rotate, fade, revert). Three signals tell you which:
Where price is relative to value. Outside value points to imbalance. Inside value points to balance. The gamma environment. Negative gamma points to imbalance. Positive gamma points to balance. What is ahead in the path. Trading into low volume points to imbalance, because there is room to run. Trading into high volume or a significant level points to balance, because the move gets capped.
When the signals line up toward imbalance, you take breakout and continuation trades. When they line up toward balance, you take reversal and mean reversion trades. Reversals go well with positive gamma. Breakouts go well with negative gamma.
A quick word on gamma
You do not need to be an options expert. Here is all you need. Negative gamma means dealer hedging pushes moves further, so the market expands and breakouts run. Positive gamma means dealer hedging fades moves back, so the market contracts and reversals work while breakouts die. Negative gamma, expect expansion. Positive gamma, expect the fade.
Outside of what, exactly
When I say outside value, be precise. The primary read is the previous day's value area. The previous week's value area counts too. The current week's developing value area is a bonus read, and as a rule of thumb I only pay attention to it once it is Wednesday or later. Above value leans bullish. Below value leans bearish. Inside value points to balance, so breakout trades lose priority and a mean reversion or reversal back toward value becomes the cleaner B grade idea, especially in positive gamma.
Direction is symmetric Everything here works the same long or short. Above value leans bullish. Below value leans bearish. If you trade against that expected direction, you need a much better reason and a smaller size. Taking a counter trend trade against value is the exact same mistake whether you are long or short. Every bullish example in this SOP has an identical bearish mirror. The only thing that matters is whether you are trading with the direction the condition expects, and whether your setup type matches the regime.
Part III
The Process: Grade the Setup, Size to the Grade
The Process: Grade the Setup, Size to the Grade
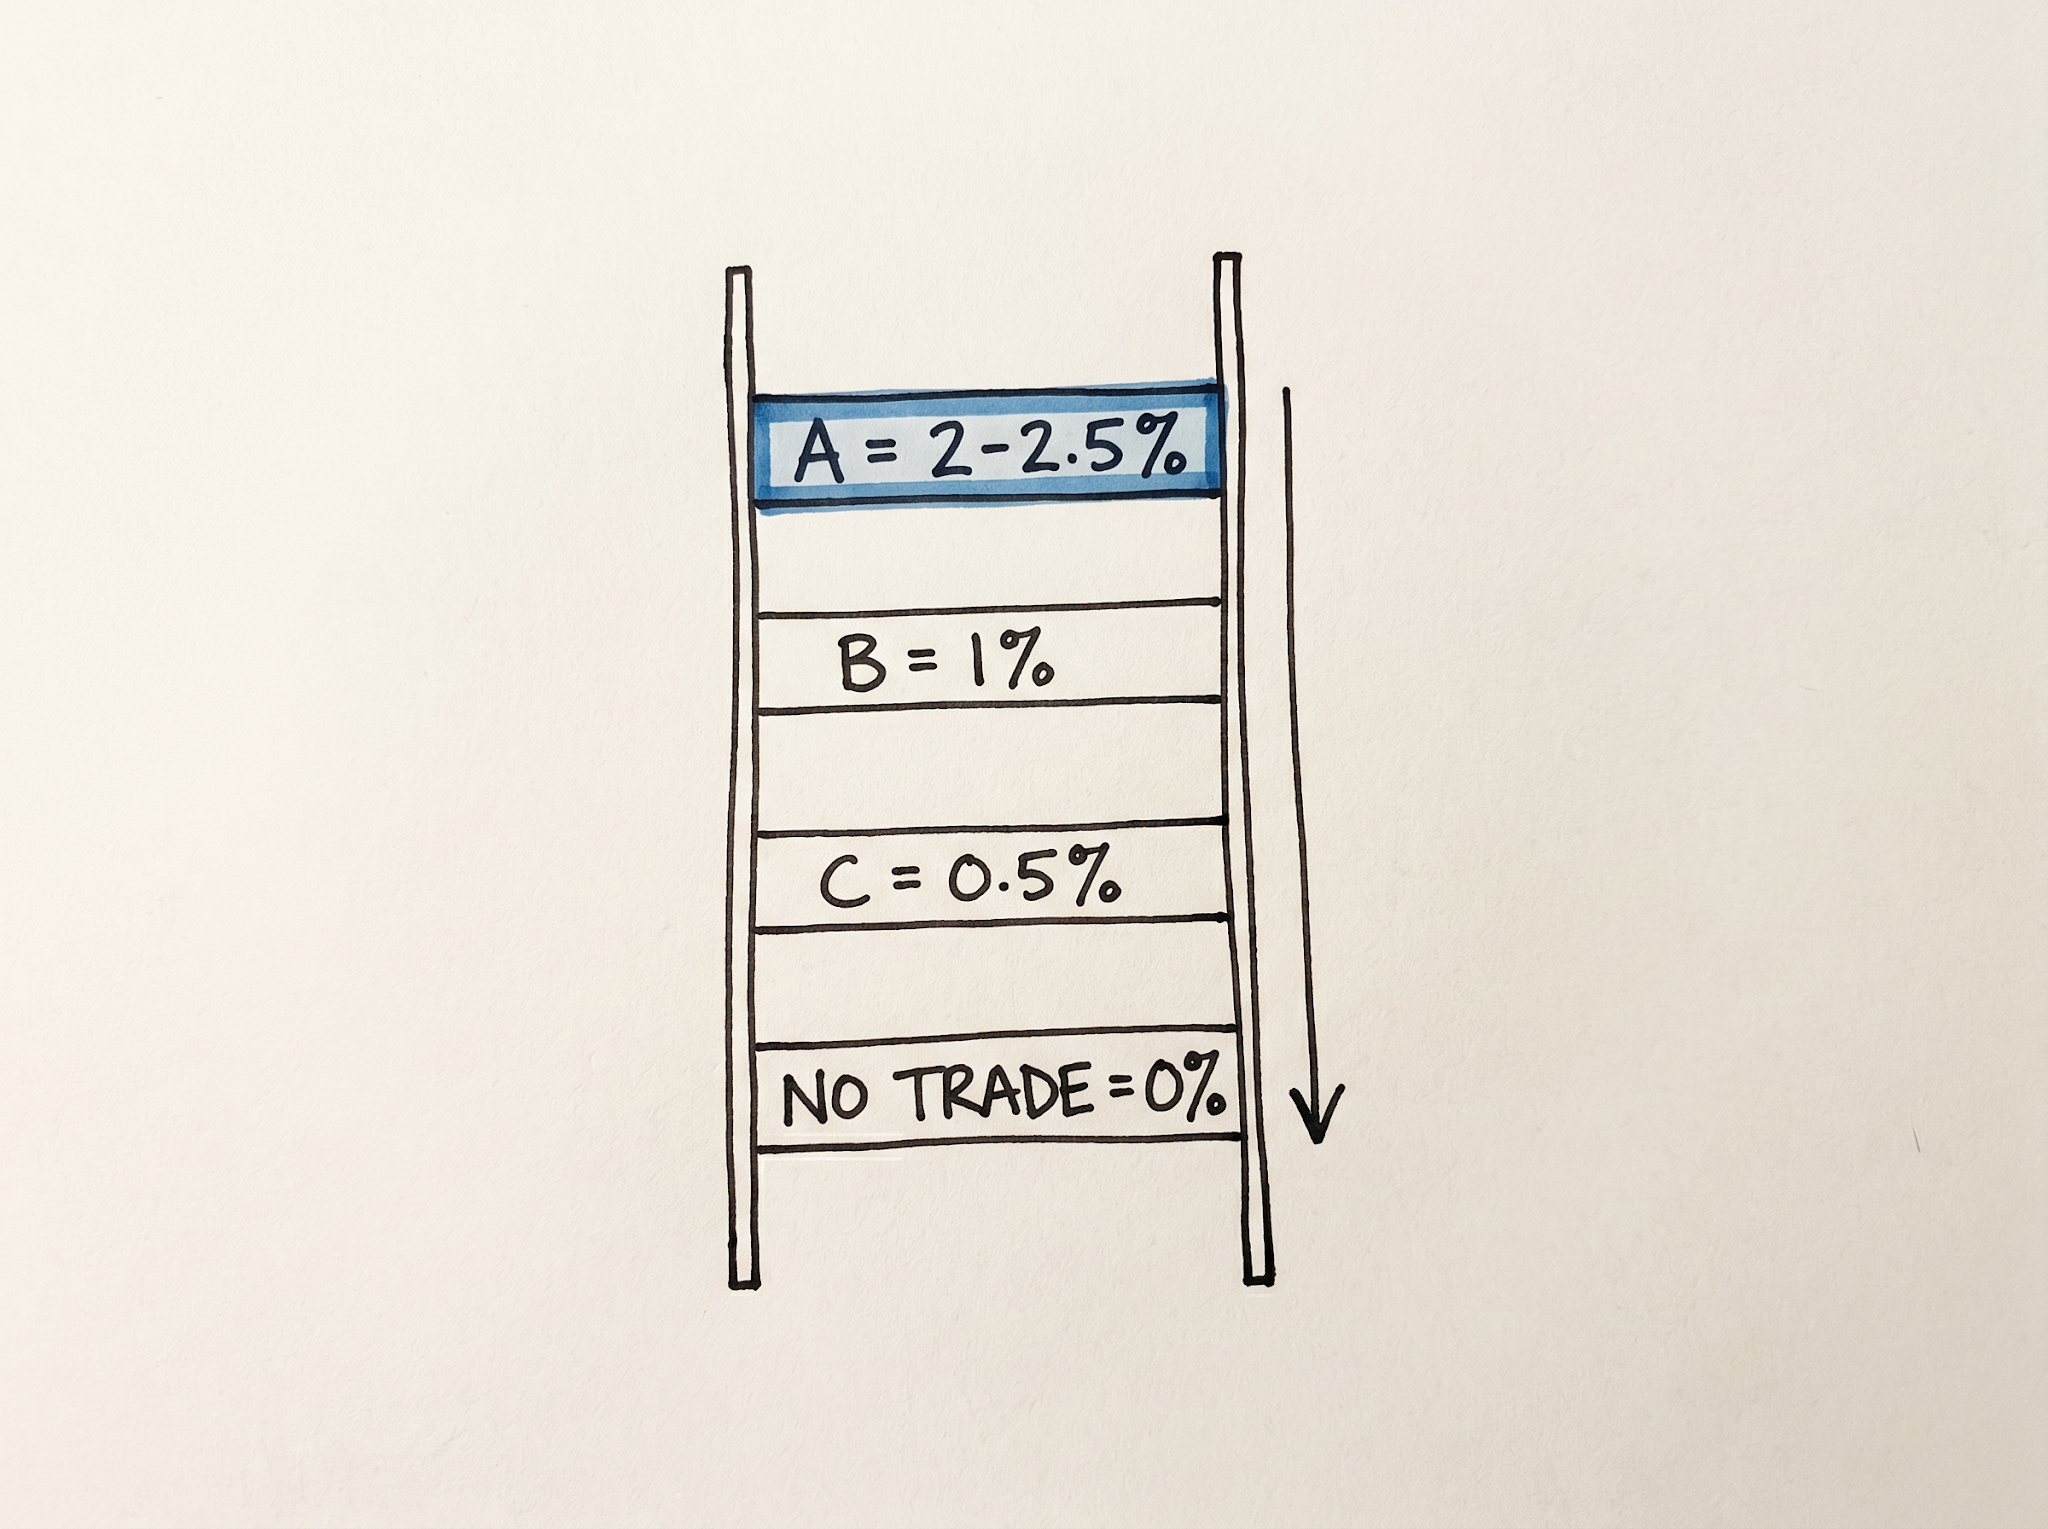
This is the system. We take A, B, and C setups. Nothing less. Below a C is a no trade. The grade ladder
There is no fifth size. A, B, C, or nothing.
How to grade: count the signals
Once you are trading with the read, the grade comes from how many of the three signals stack in your favor, weighed against whether your setup type actually fits the condition. It is not blind arithmetic. All three stack and the setup fits the regime, that is an A. One thing is soft, a level in the way or gamma mismatched, that is a B. The setup has bad odds but a huge asymmetric payoff in low volume, that is your only C. You are fighting the read, that is a no trade.
The worked examples
These are the actual situations you will face. Learn them and you can grade any setup.
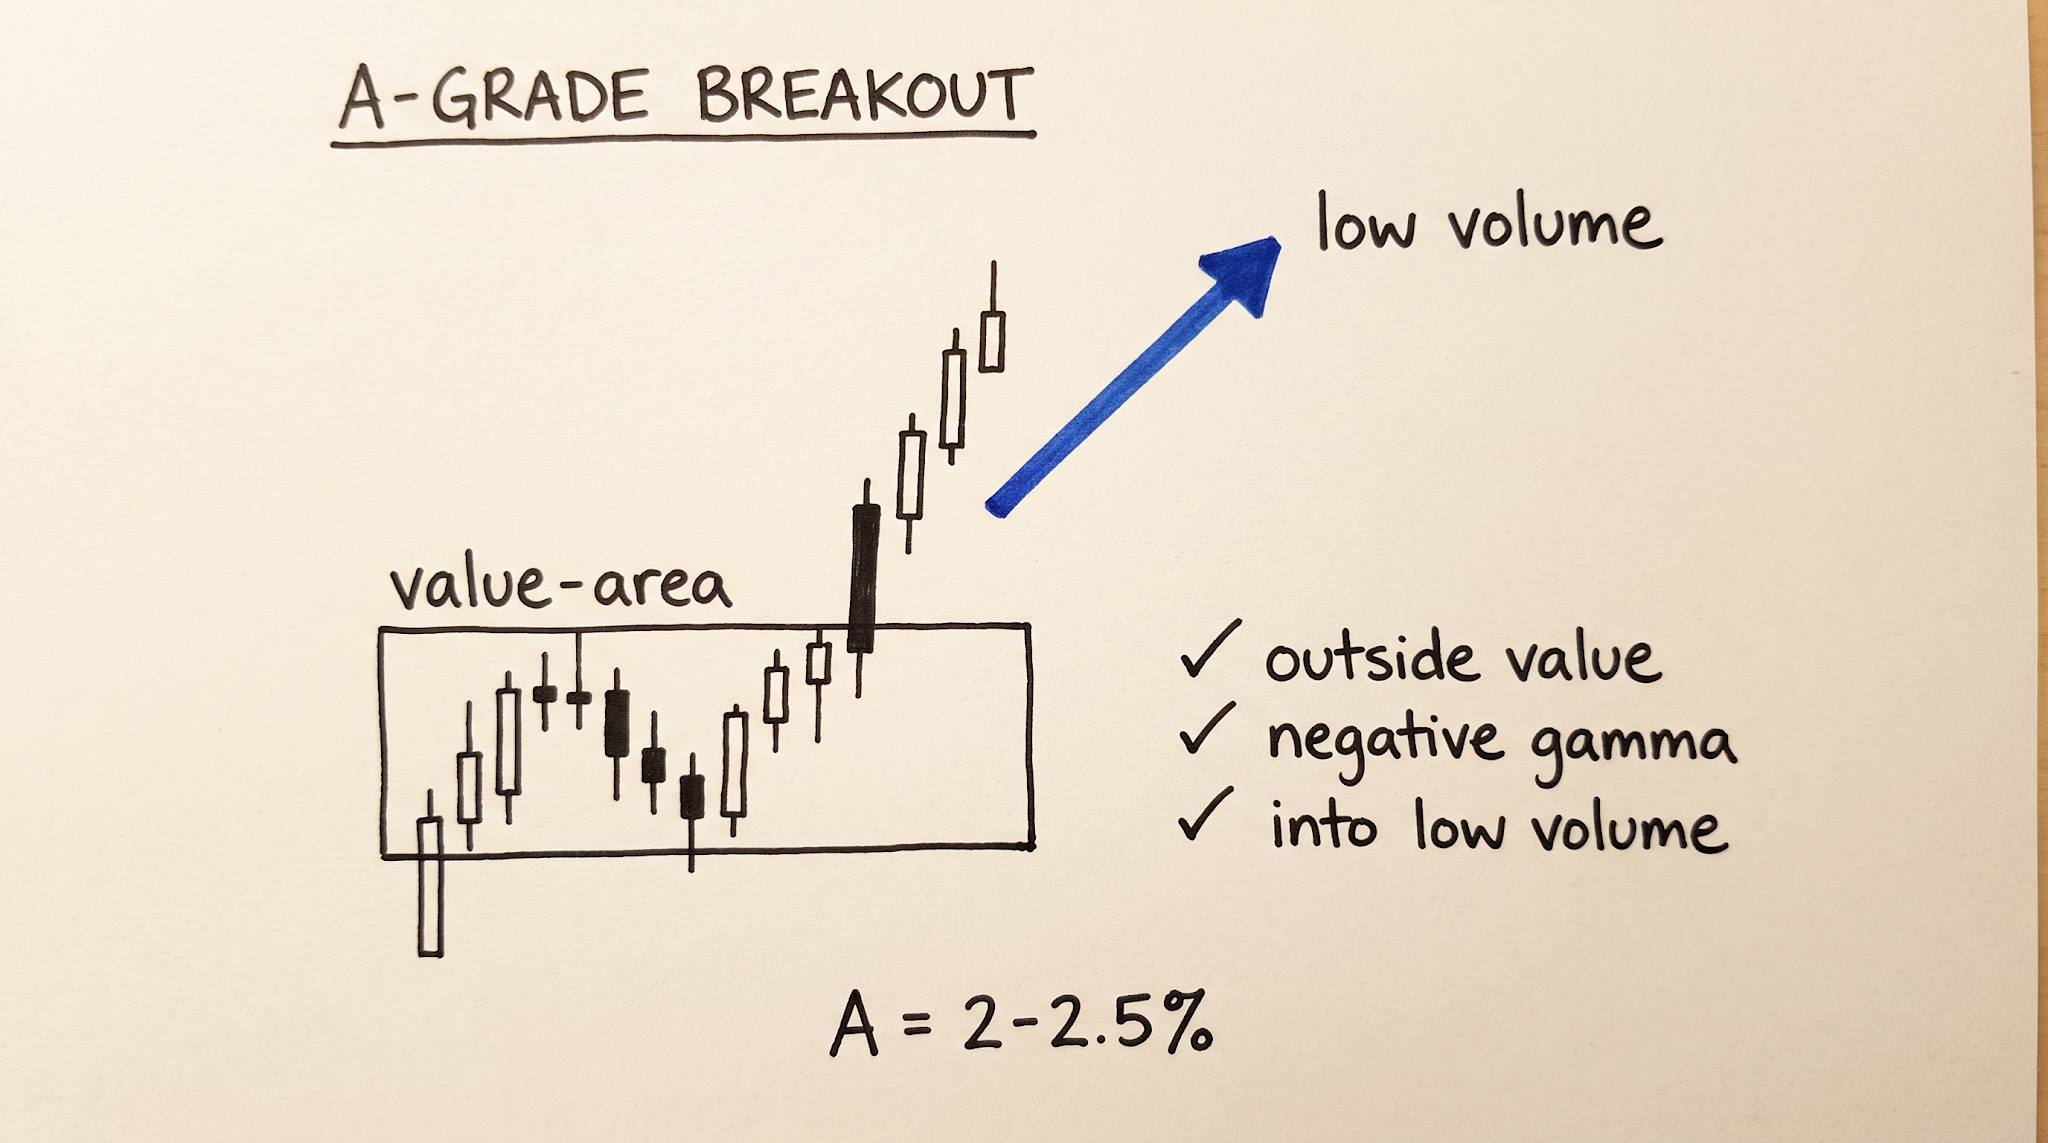
Example 1: Full risk. The A. Easy mode. You are above the previous day's value, so the condition is bullish. You are in a negative gamma environment, so expansion is expected. You are taking a bullish breakout you are already bullish on, and you are trading into an area of low volume with nothing blocking the path. A first-candle rule that fires in this exact stack, negative gamma and aligned with the value direction, is the cleanest version of this trade I take. Every signal stacks. This is the only kind of trade that earns full size. The only time I really go full risk is when I have all of that and I am trading into an area of low volume.
Example 2: No trade. Hard mode. You are bearish because you are below the previous day's value area low. The condition leans bearish. But you are in a positive gamma environment, which is a balance regime that does not support breakouts. If you go hunting a bullish breakout here, you are fighting two things at once: the bearish condition and the balance regime. That is a no trade. You are going against too many things. Notice the no trade is not because being below value is bad. It is because you went looking for a bullish setup against the read.
Example 3: Take it, but not fully in. The B. You have a bearish breakout setup, which fits a bearish condition. But you are in a positive gamma environment, and positive gamma does not support a breakout. The direction is right, the regime is off. You can still take the trade, but you are not fully in. One signal soft, so it is a B at 1%.
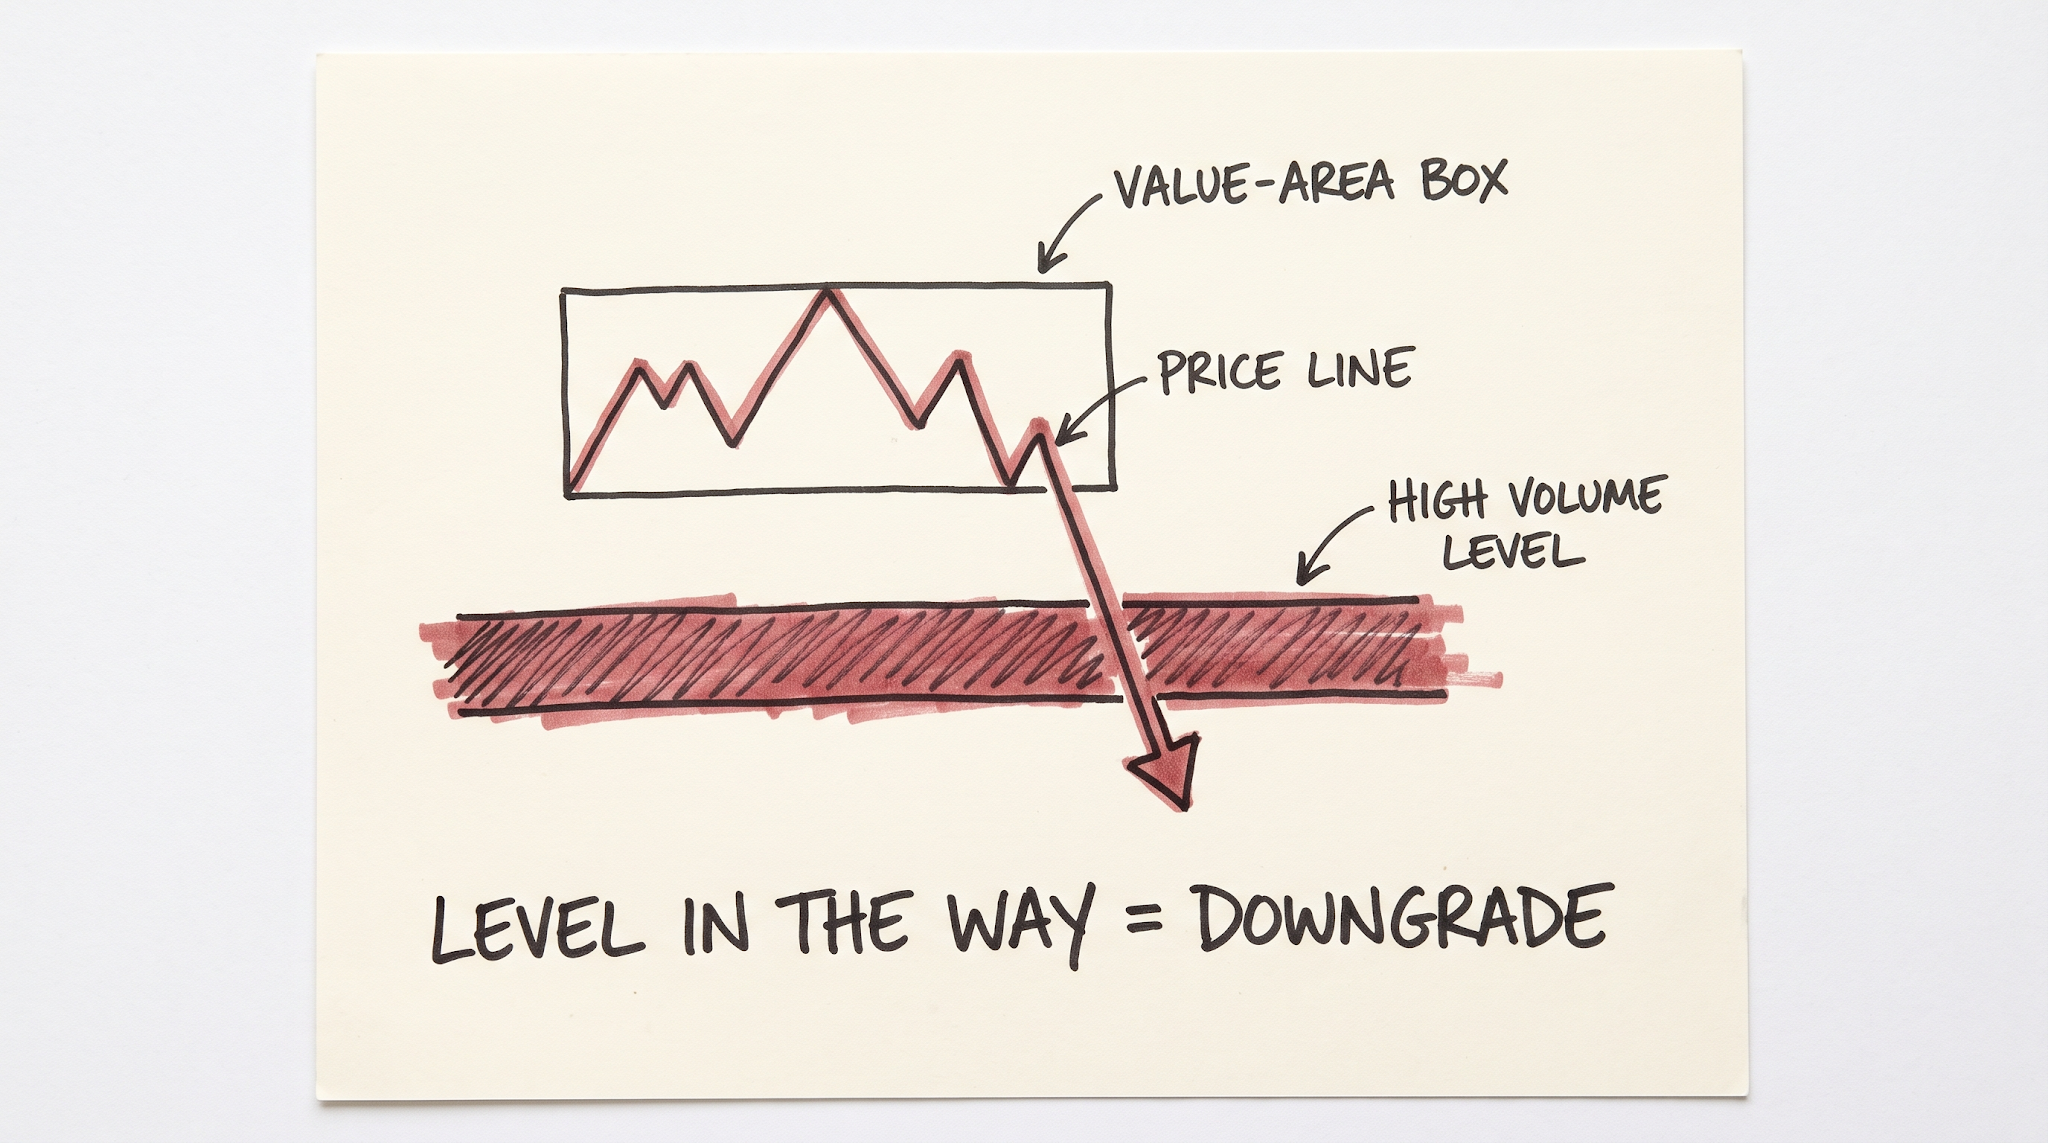
Example 4: The level in the way. You have negative gamma and you are under the previous day's value with a bearish breakout. Regime and direction agree, which would normally be strong. But there is a very high volume node or a significant level sitting just beneath you. You are not trading into low volume, you are trading into a wall. The move gets capped before it can run. That also would not be a high probability trade. Depending on how close and how significant the level is, it is either reduced size or a pass.
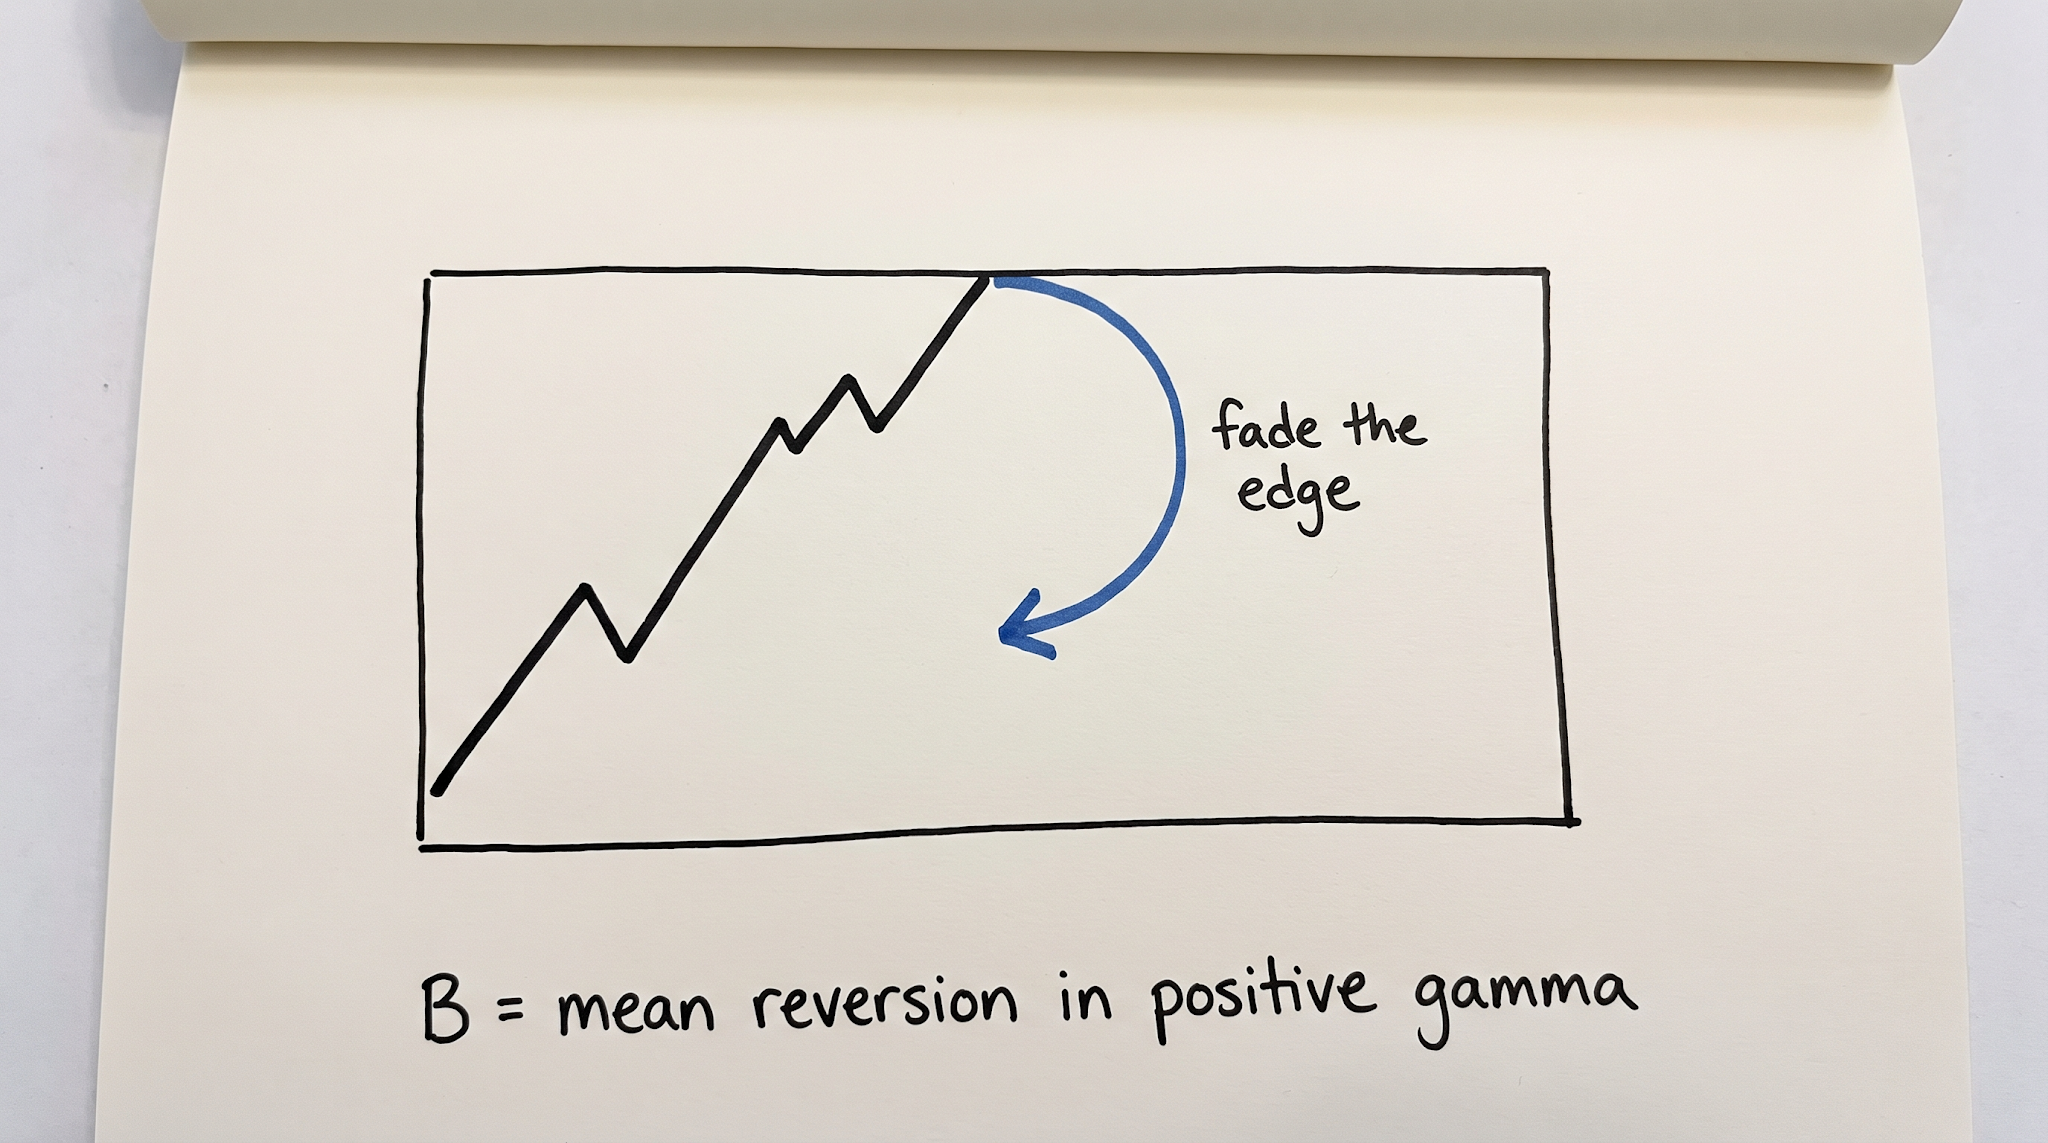
Bonus example: inside value, positive gamma. The mean reversion B. You are inside value and in a positive gamma environment. Both signals point to balance, so breakouts are off the table. You do not go hunting a breakout here. Instead you look for a mean reversion or reversal: fade the edge of value back toward the middle of value. Gamma agrees with the reversal, so it is a clean B at 1%. This is the trade most people miss because they are still trying to force breakouts in a market that is set up to fade.
Why C is mostly no trade
Most of the time, you are going to just not trade. Under trading the bad setups is the easy part. The skill is knowing the one C worth a tiny bet, the low volume lottery where the odds are bad but the move is huge if it hits, versus the nine that are just gambling. Even that one gets 0.5% or less.
Pro tip: Knowing when to put your foot on the gas is harder than being a hermit crab who risks half a percent on everything. Most traders risk less and tell themselves they are being smart. They are not. They are securing a slow death by a thousand cuts. Under sizing your A setups is its own failure. The whole game is sizing up when the deck is loaded and sitting on your hands the rest of the time.
Overall Risk Controls
The grade sets the size on a single trade. These two rules govern the day. The re-entry tax
Avoid taking full size trades very close together. If you take a 2% trade and get stopped out quickly, do not go right back in at 2%. Go in at 1% and scale in from there. Clustered full size losses are how a normal red day becomes a blown account. The re-entry is taxed. The daily ceiling Never lose more than 5% in a single day. That is the loss stop, and it is the same as your max risk deployed, because you would never put on more than you are willing to lose. Five percent is rare. It only happens on a day stacked with multiple A setups, and usually I cut it off before then.
On a normal day, where things are not very high probability, total risk for the day is 2%. Then you are done.
Pro tip: The daily ceiling is not a target. It is a wall. The skill is knowing the rare day worth pushing toward 5%, which is a day full of A setups, versus the normal day that caps at 2%.
Part IV
The Prop Firm Translation
The Prop Firm Translation: Your Drawdown Is Your Real Account
Everything above is the system on your own capital. On a prop firm challenge, you keep the exact same A, B, C system. One thing changes, and it is the most important thing most prop traders get wrong.
Your drawdown buffer is your real account size. Not the number on the screen.
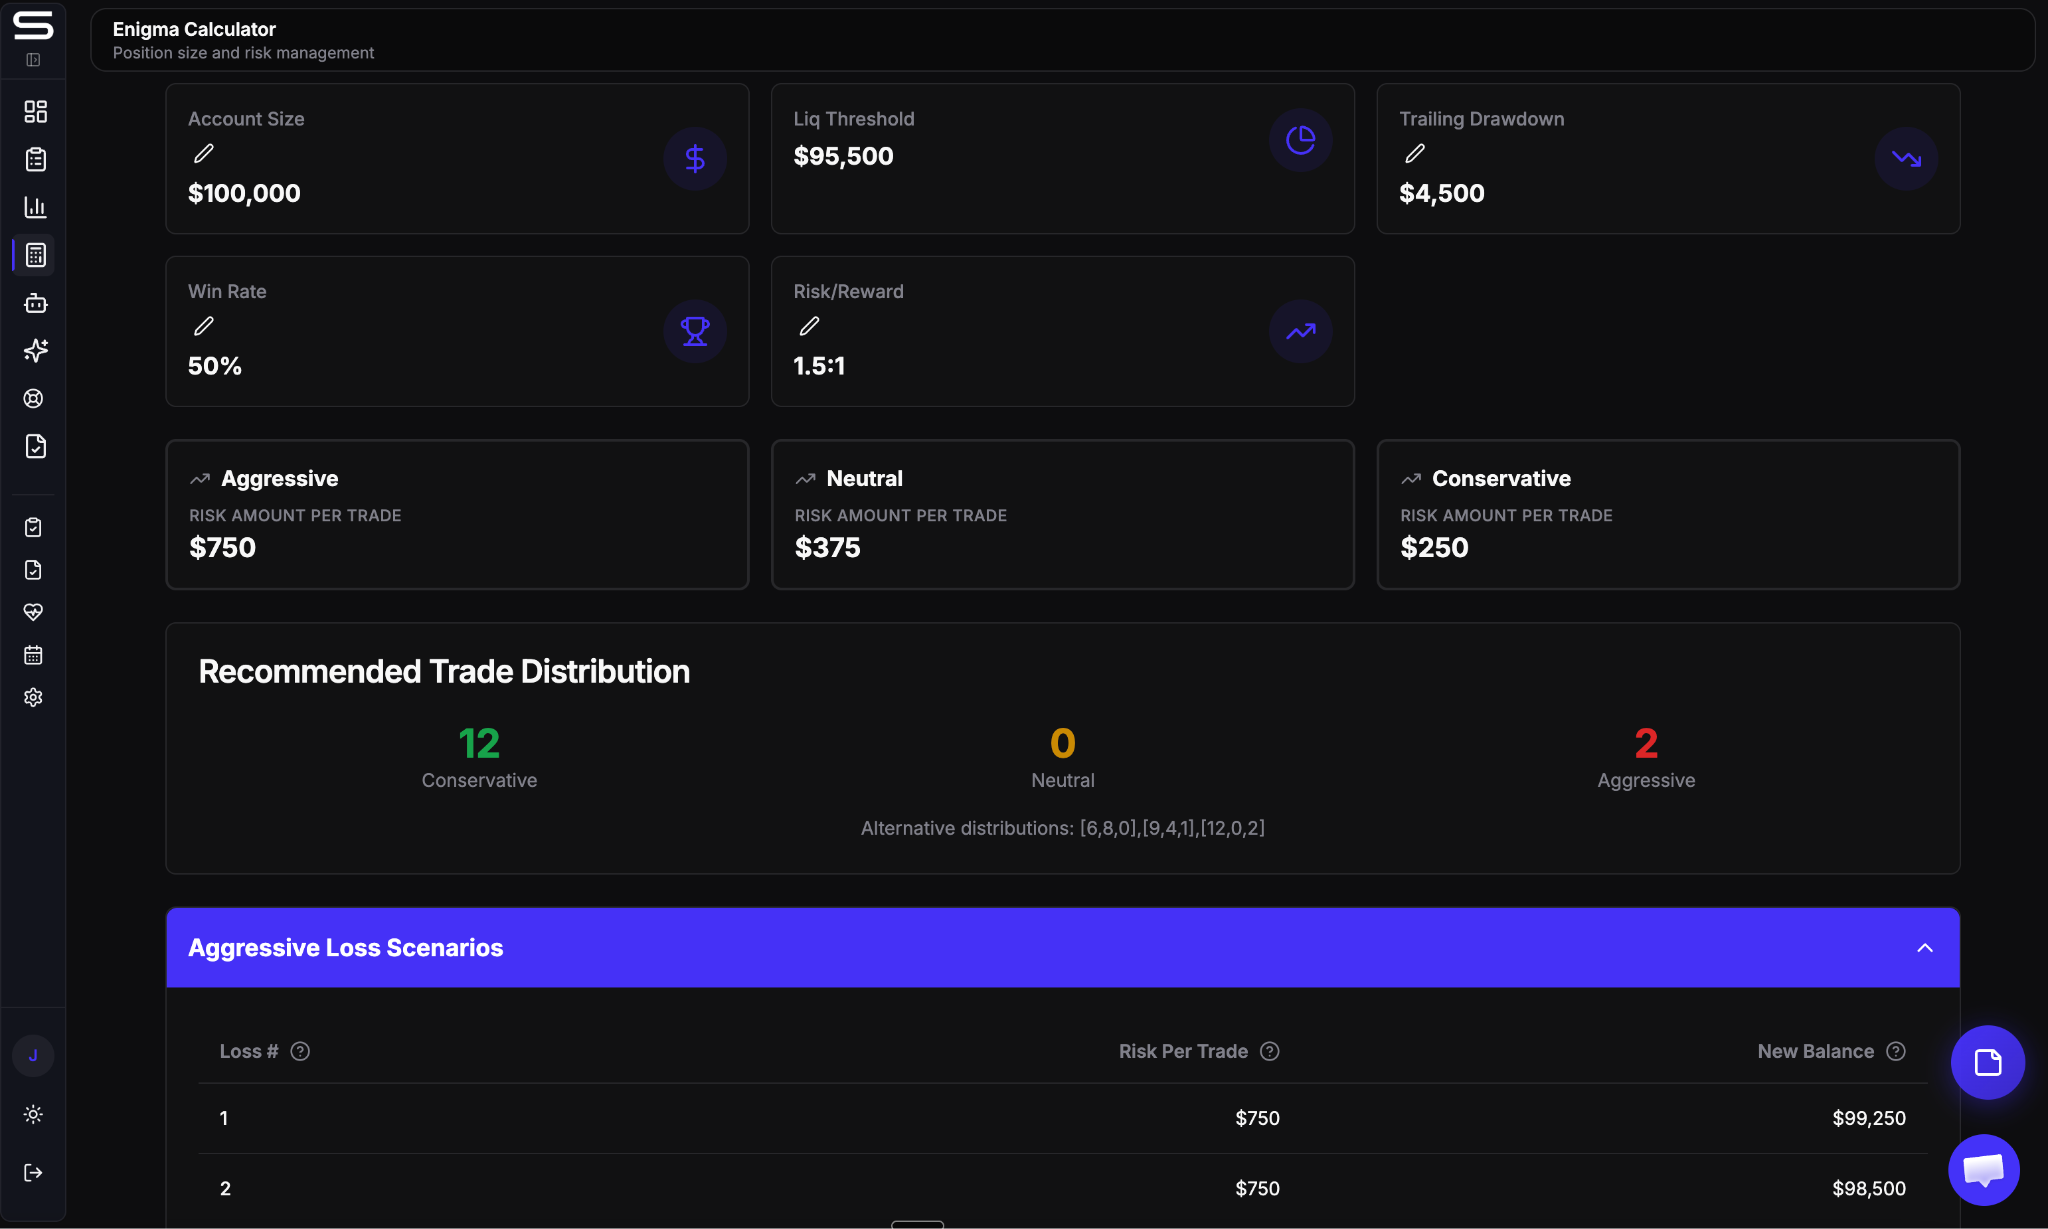
A 50,000 dollar account with a 2,000 dollar trailing drawdown does not behave like 50,000 dollars of real capital. It behaves like an account with 2,000 dollars of room to lose before it dies. So you size to the drawdown distance, not the account size. (That 2,000 dollar figure is the published Apex trailing distance on a 50K evaluation. Every firm is different, so check yours.) You keep the A, B, C grade logic exactly. A setups are still your biggest, C setups your smallest, no-trades are still no trades. What changes is what the dollar risk is anchored to. On your own capital it is a percent of your account. On a prop account it is a percent of your remaining drawdown buffer.
How much I’d risk
NOT FINANCIAL ADVICE: Here is my actual starting point. If you have a very high win rate strategy, 60% or above, at break even you are usually going to risk 20 to 30% of the drawdown buffer on the trades that deserve risk. That sounds aggressive until you remember the buffer is small and a high win rate strategy rarely strings together the losers that would breach it. As you take losses, you have less drawdown to work with, so your risk decreases automatically, because the buffer itself is shrinking. The percent of buffer stays, the dollar amount falls. Scale B and C down from the A by the same grade logic you use on your own capital, the A biggest and the C smallest. I have given you my A starting point on a prop account. The precise B and C buffer percentages depend on your firm's trail and your own numbers, which is what Enigma solves by building the plan from your data. Why win rate and reward-to-risk change your size
This is the Kelly Criterion, briefly. Kelly is the math for how much to bet to grow an account the fastest. The formula is f equals bp minus q over b, where b is your reward to risk, p is your win rate, and q is your loss rate. You do not need to memorize it. You need the conclusion it produces.
A 60% win rate at 1 to 1, full Kelly says about 20%. A 65% win rate at 1 to 1, full Kelly says about 30%. A 40% win rate at 3 to 1, full Kelly also says about 20%, but it gets there through rare big wins and long losing streaks in between.
Those are full-Kelly outputs. Do not blindly risk full Kelly. The inputs are estimates, and full Kelly drawdowns get ugly, so most professionals trade a fraction, a half or a quarter, to keep it survivable. The takeaway is the direction: a higher win rate supports risking more, and a high reward to risk but low win rate supports risking less, because the losing streaks are brutal. On a prop account that fraction matters even more, because a trailing drawdown is a hard wall. A low win rate, high reward to risk strategy can hit a perfectly normal losing streak that breaches the trail and ends the account, even though the strategy is profitable over hundreds of trades. A higher win rate strategy has shallower dips and survives the trail. Kelly and the trailing drawdown are two completely separate reasons that point at the exact same answer. High win rate, risk more. Low win rate with high reward to risk, risk less.
Pro tip: A trailing drawdown trails your highwater balance and only moves up, never down. On an intraday trail it ratchets up the moment your open profit prints a new high, and it stays there even if the trade reverses. That is why giving back open profit is so dangerous on a prop account. Verify your specific firm's trailing rules before you size, because the distance and the rules vary by firm. Enigma does this for you
This is what we built Enigma for. Enigma is our proprietary software tool inside Smart Trading Blueprint. It takes your trading data and builds a prop firm plan that mathematically gets the most out of the trailing drawdown for any prop firm size or account. Instead of doing this math by hand, you let Enigma build a prop firm plan from your win rate and reward to risk that gets the most out of the trailing drawdown.
Part V
The Break-Glass Play and Your Worst Window
The Break-Glass Play: House Money
I am going to be honest with you in a way most coaches will not, because the alternative is teaching you a sanitized version that the best traders do not actually follow.
When you reach a certain point, when you have been profitable for a very long time, there will be days where you just know you are on a run. A lot of people find this counterintuitive. When you are up really big on the quarter and the environment is moving really fast, the stars do align and you start to risk a little bit more. That is the raw reality of trading.
I have grown an account from 10,000 to 200,000. When you are very much in surplus, when conditions are aligned and your life is supporting your trading, sometimes you press. But you only do this when it is house money, and you have to make sure not to give it all back.
Here is the rule. Say you are up 300,000. You might get extra risky, but only until you are backed up to where you are only up 150,000. That is the line. The surplus funds the extra risk. The moment you have given back half the surplus, the override is off.
People call this a gambler's mentality. It is just the reality of trading. You are never going to have the generational runs and the real breakthroughs until you can have balls of steel and put your balls on the table a lot of the time. The industry spreads a lot of heroic, stoic, stupid stuff about never taking big risks. At the end of the day, we are risk takers. We are traders. You do it in a logical manner, you think for yourself, and you understand that this is how the top traders actually operate. Look at any trader who has had a big run. I promise you they were not risking 1% of their portfolio on every single trade.
This is not for beginners. This comes with responsibility and it comes with time. If you are having to question whether this is for you, then it is not for you.
And do not confuse this with revenge sizing. House money is pressing surplus you have already earned, with a hard give-back line, when conditions are aligned. Revenge is sizing up to make back a loss, out of anxiety, against your read. House money is earned and gated. Revenge is the death spiral. They are opposites.
Find Your Own Worst Window
One more piece, and it is about thinking for yourself instead of swallowing dogma. You hear it constantly. Do not trade at certain times of day, as if there is one bad time and one good time for every trader on earth. Do not trade before news days. Do not trade on news days. None of it is universally true. There are no constants, and nothing applies to every single trader. For one trader, a time window that sucks is another trader's best window. A lot of what gets spread around as absolute is just marketing gimmicks and nonsense. It makes you overthink, it makes you blindly follow dogma, and it sets you back years, because you are following information from people who are not even profitable traders.
You have to think in first order principles and question everything.
I used to follow these things blindly. Then I got the chance to ask a trader who had been institutional many years ago how he looked at this. What that desk did was identify that some of their setups worked better during different times of the year, closer to earnings. That inspired me to make it granular on a day trading level. I started looking at my profitability windows by day of the week and by time of day.
Trades between 9:45 and 10:00 a.m. turned out to be some of my worst trades recently. My best trades happen between 10:00 a.m. and 12:00 p.m. Yours will be different. The point is the method, not my hours. Find the 15 or 30 minute window of the day where you are least profitable, and just skip it. That is the kind of gem that actually moves the needle.
You will make more money in trading by being wrong less than you will by being right more.
On news, just use common sense. Do not trade right before news. Even if I am in a trade and holding it with my stops far away, I will hold through news sometimes. Most news I do not pay attention to. Only the big ones, CPI, FOMC, and the like.
Part VI
Build the Data: How to Actually Run This
Build the Data: How to Actually Run This
A system you do not track is a system you will abandon. Here is how to make it stick. Step 1: Keep a hand journal Every trader should keep a journal, and the first step is just being aware of what you are doing. Write down your decision making and how it made you feel. Write about the emotional triggers that made you step out of the system. You have to build the data before you fully commit, because at the end of the day you need conviction in what you are doing, and conviction comes from your own numbers. Step 2: Tag every trade A, B, or C In your journaling software, add a tag or a note on every trade for whether it was an A, a B, or a C setup. Then look at your metrics by grade. You will find that your losses cluster where you sized a C like an A, or where you traded against the read at all. Step 3: Let AI find your patterns You can take a CSV of your trade journal and have AI define your A, B, and C setups from your actual results. Here is a prompt that does it. It does not just spit out a generic answer. It interviews you, the way a real coach would, to find the real difference between your best and worst trades. Copy and paste this into any AI:
You are my trading sizing coach. Your job is to look at how I actually trade and help me define my A, B, and C setups so I can size each trade to its real quality. Do not give me generic position-sizing advice. Work only from my data and my answers.
Here is the system you are grading me against. Use it as your starting lens, then personalize it to my actual results:
THE SIZING SYSTEM - Every trade gets a grade, and the grade sets the size. We take A, B, and C setups. Nothing less than a C is a no-trade. - A setup = 2 to 2.5% risk - B setup = 1% risk - C setup = 0.5% or less (only the rare "lottery" trade: bad odds, but a huge move if it hits) - No trade = 0% - The grade comes from two questions: 1) Are we expecting BALANCE or IMBALANCE? Decided by three signals: - Price OUTSIDE value = imbalance. Price INSIDE value = balance. - NEGATIVE gamma = imbalance. POSITIVE gamma = balance. - Trading INTO low volume = imbalance. Into high volume / a level = balance. 2) Am I trading WITH the direction I expect, or AGAINST it? (Above value = trade it bullish. Below value = trade it bearish. Counter-trend to value is the same mistake either way.) - Setup type must match the regime: breakouts go with imbalance / negative gamma; reversals go with balance / positive gamma. - More signals stacking when I trade WITH the read = higher grade. All stack = A. One soft = B. Bad odds but huge-payoff lottery = C. Fighting the read = no trade.
ACCOUNT CONTEXT First, ask me one question: are these trades on a prop / funded account with a trailing drawdown, or on my own capital? If prop, remember my real account size is the drawdown buffer, not the notional, and size advice should respect the buffer.
WHAT I'M GIVING YOU I'm pasting my trade journal below (or attaching a CSV). It may or may not already be tagged A / B / C.
WHAT TO DO, IN THIS ORDER STEP 1 - Check my data. Tell me what fields you can see. If trades are NOT graded A/B/C, reverse-engineer grades from outcomes, R-multiples, and notes. Do not make me tag them first.
STEP 2 - Grill me. Ask me 3 to 5 questions, ONE AT A TIME, waiting for my answer before the next. Start with these three core questions, then ask 1-2 of your own based on my data: 1. "Look at your 3 most profitable trades and your 3 worst. What did the winners have in common that the losers didn't?" 2. "When you took your biggest losers, what were you feeling or telling yourself right before you entered?" 3. "Were your best trades with the direction of value, or against it?"
STEP 3 - Personalize my grades. Using the framework, my answers, and my data, write my personal A / B / C setup definitions in plain language I'd recognize, tied to my instruments and my real behavior. Not generic.
STEP 4 - Metrics per grade. For each grade, give me: number of trades, win rate, average R, total P&L. Make it obvious which grade makes me money and which I should stop taking.
STEP 5 - Find my worst window. From the timestamps, find the 15-to-30-minute window of the day where I am LEAST profitable. Tell me to consider skipping it.
STEP 6 - Give me ONE fix. The single highest-leverage change to my sizing or trade selection. One thing. Specific.
Be direct. If my data shows I'm sizing C-grade setups like A-grade setups, say it plainly. Push back on me. That prompt works for anyone. If you are already a member of Smart Trading Blueprint, you do not have to do any of this manually. Smart Trader AI already has all of your data, we have pre-made prompts that run this for you, and our coaches help you work through it.
The Casino
I told you at the start there is one key difference that makes trading better than the casino. Here it is.
A blackjack card counter has an edge, but the casino still controls the game and the counter has to play the hand in front of him.
The trader does not.
We sit and watch multiple tables. We wait for the running count to swing in our favor. Only then do we go all in. We can get up from any table whenever we want, and we can refuse to gamble at all.
The summation of all of it is this. We get to select our odds. That is the one thing a casino will never let a card counter do, and it is the entire reason this works. We get to select our odds.
Immediate Action Items
Print the grade ladder and tape it to your monitor. A is 2 to 2.5%, B is 1%, C is 0.5% or less, anything less is a no trade. Before your next trade, run the two questions. Balance or imbalance. With the read or against it. Grade it, then size it. If you are on a prop account, recalculate your risk against your drawdown buffer, not your account size. Or let Enigma do it. Start tagging every trade A, B, or C in your journal today. Once you have enough trades logged, run the AI prompt on your CSV and find your worst window. Stop hermit-crabbing your A setups, and stop sizing your C setups like A setups. Then tag your next 20 trades and compare P&L by grade.
Take This Further
This playbook gave you the sizing system. Now let an AI-powered roadmap adapt it to your account, your setup, and your risk profile. Answer a few questions and get a personalized plan that connects sizing to your next step as a trader.
Get Your AI Roadmap